Mobile apps have terrible retention. Don’t believe me? See for yourself.

Mobile apps lose 77% of their daily active users within the first 3 days after install, and 90% within the first 30 days. Understanding mobile app retention benchmarks is critical for determining whether your app is performing well or bleeding users faster than you can acquire them.
Given the millions of apps accessible in the app store, users can’t afford to spend more than a couple minutes checking a new app out. If they do stick with you beyond this initial phase, you face another challenge: getting them to come back regularly.
In this blog, we will explore what retention is, why it’s important, average retention rates for mobile apps by industry and even strategies for opimizing retention. Let’s dive in!
TL;DR
- Average 30-day retention across all apps is just 6%, meaning 94% of users churn within a month
- D1 retention rates vary dramatically by industry: Fintech (30.3%), Gaming (28-33%), Social Media (26.3%), Health & Fitness (20%)
- A “good” retention rate is 10-30% at Day 30, but this varies significantly based on your app category and natural usage frequency
- Retention is the strongest indicator of product-market fit - apps that haven’t achieved PMF will see their retention curve drop to zero
- Focus on three retention phases: New user experience (activation), mid-term retention (habit formation), and long-term retention (sustained value delivery)
What is retention rate?
Retention rate refers to the percentage of users who continue to use an app after a certain period of installing it. It is a critical metric for app developers as it indicates user engagement and satisfaction with the app.
High retention rates indicate that users find the app valuable and are willing to continue using it, while low retention rates suggest that users are not finding the app useful or engaging enough to keep it installed.
Importance of high retention for mobile apps
A high retention rate means that users are finding value in the app and are likely to continue using it and vice versa. Also, it can affect a variety of down-funnel metrics.
Perhaps most importantly, retention rate is crucial in determining PMF. By ensuring that a product or service meets the needs and expectations of its target market, companies can improve customer satisfaction, enhance engagement, and reduce churn, all of which can lead to higher retention rates over time that eventually help in attaining PMF.
When your product has achieved product market fit, your user retention will flatten out over time. An app which hasn’t hit PMF will lose users every day till their retention curve hits 0.

There are broadly four important reasons why retention rates are important for mobile apps:
Higher LTV
Retaining users for a longer period increases LTV per user. If users abandon the app after their initial download, they are unlikely to make in-app purchases, subscribe to premium features, or view advertisements.
Increased virality
High retention rates mean users get more touch-points to interact with your app, and they are more likely to refer you to other users, talk about you organically, etc thus improving your virality coefficient.
Lower cost per acquisition
Acquiring new users can be costly, especially in highly competitive app categories. If you have high retention, and thus higher LTV (as mentioned above), you will be able to afford higher costs per acquisition and outbid your competitors.
App store rankings
Retention rate is a factor considered by app store algorithms when ranking apps in search results. Apps with higher retention rates are more likely to be recommended to users, leading to increased visibility and downloads.
How to calculate retention rate?
Retention rates are usually measured over specific periods: 30 days, 60 days, or 90 days. To calculate the 30-day retention rate, use this formula:
30-Day Retention Rate = (Number of users active on Day 30 / Number of users who installed on Day 0) × 100

Two key points to note:
1. Match measurement frequency to your product’s natural usage pattern
The decision on whether you should calculate retention rates on a 30/60/90-day basis depends on your product’s natural frequency. It makes no sense for Airbnb to calculate 30-day retention rates because people don’t use Airbnb on a weekly or monthly basis. Apps like Spotify or Notion measure even 7-day retention rates because users engage daily.
2. Measure value delivery, not just app opens
Just measuring retention on active users may not be best for your product. If people are opening the app but not getting value in that interaction, those users are at risk of churning. Count them as retained only if they perform actions that deliver your core value proposition.
In addition, you can use cohort curves, interval time series, and triangular charts to deeply understand retention patterns.
Key terms you need to know
D1 retention rate (Day 1): The percentage of users who return to your app one day after installation. This is your first critical checkpoint—it reveals whether your onboarding delivered immediate value.
D7 retention rate (Day 7): Users who return after one week. This measures whether you’ve successfully formed an initial usage habit.
D30 retention rate (Day 30): The industry-standard benchmark for app user retention. This metric indicates whether users have integrated your app into their routine.

What is a good retention rate for mobile apps?
A good retention rate for mobile apps varies depending on the industry and app type. Generally speaking, a retention rate of 10-30% after 90 days is considered good. However, some apps such as social media or gaming apps may have higher retention rates, up to 30% or more.
It’s important to note that a higher retention rate doesn’t necessarily guarantee success—user engagement and lifetime value also play important roles.

From the diagram above, it’s worth noting that the difference in retention averages between Android and iOS users is minimal. The graph presents the 30-day average retention rate for both platforms.
Key findings from Adjust’s research:
- 14% decrease in retention for Android by the end of the first week
- 15% drop for iOS in the same period
- Additional 4-5% attrition rate two weeks later across all apps
- 30-day retention rate levels out at approximately 6%
According to AppsFlyer, iOS retention rates have been increasing recently, while Android saw a 16% drop in day 30 user retention within the last full year.
Generally, any retention rate surpassing this benchmark can be regarded as positive. An app with over one-third of users retained on the first day after installation is considered high-performing.
Average retention rate for mobile apps by industry
Retention rates vary significantly by industry, with some industries having higher rates than others. The reasons for these fluctuations are many! And, can only be nailed down by extensive data-backed analysis. Going forward, we will discuss the average retention rates for some of the most popular app categories.
Before getting into the industry-specific analysis, below shown is a broad graph that cumulatively shows the average mobile app retention rates on Day 1 and Day 30.

Some differences in retention across industries can seem obvious after giving it some thought. Consider the difference in 30-day retention between Fintech and Dating apps. The stickiness in a Fintech app is higher because people would have linked their bank account and provided more financial details which make them committed to a particular fintech app. But in the case of a dating app, the user might churn out and try other similar apps, in case they don’t get great matches in the first 15-30 days.
Fintech app retention rate
They are designed in such a way that the capital of users is at stake. These apps typically enjoy higher retention rates than average. This makes it to be one of the top players retention-wise on Day 1.
Day 1 Retention: 30.3%
Day 30 Retention: 11.6%
But, the above rates hold only when the traditional and digital banking apps are put together. Customer retention goes down when we look at fintech apps that target services other than that banking. It is noteworthy though that losing 17/20 of your customers after 30 days is usual.
Food delivery app retention rate
The retention rates of food tech applications can vary depending on several factors, such as the quality of the user experience, the features of the application, the frequency of use, and the relevance of the application to the user’s needs.
Some food tech applications may have high retention rates if they offer unique and useful features that users cannot find elsewhere, or if they provide personalized recommendations based on user preferences.
Day 1 Retention: 16.5%
Day 30 Retention: 3.9%
Statista’s estimate puts the day 30 retention of foodtech at a safe spot of 3.9 which is ideal.
E-commerce app retention rate
The retention rates of e-commerce applications can be affected by several factors, such as the quality and variety of products offered, the level of customer service, the user experience, and the pricing strategy.
E-commerce applications with a high retention rate offer a wide range of products that meet the needs and preferences of their customers. But, the subcategory that leads this space will be marketplaces such as Amazon, Flipkart, etc. Hence, the average retention rates for them are listed as follows.
Day 1 Retention: 33.7%
Day 30 Retention: 8.7%
The retention rate on Day 30 relative to Day 1 is relatively high here compared to other industries as a marketplace offers multiple products that the user needs for which they frequently return.
Gaming app retention rate
The retention rates of mobile gaming applications can vary depending on several factors, such as the quality of the game, the level of engagement, the frequency of updates, and the ease of use.
Day 1 Retention: 28.7% - 33.2%
Day 30 Retention: 2.3% - 5.4%
The retention rates seen above are for pretty obvious reasons. The game gives a peak of excitement on Day 1 while it tends to bore the users in most cases around Day 30. But, this figure is just an average and great game like PUBG or COD tends to have a high retention of up to ~23%.
Health & fitness app retention rate
Retention rates in health tech mobile applications can be influenced by the frequency and relevance of notifications. Notifications can be a powerful tool for engaging users and encouraging them to return to the application. However, if notifications are too frequent or not relevant to the user’s needs, they can become annoying and lead to user churn.
Day 1 Retention: 20.0% - 20.2%
Day 30 Retention: 2.78% - 4%
High retention rates are important for health tech applications, as they can lead to improved health outcomes for users, increased user engagement, and sustained revenue from in-app purchases or subscriptions.
The above Day1: Day30 ratio stands at ~ 5:1 which means, 1 out of 5 users churn by the end of a month. Hence, adding more social features to the application will make sure of holding a higher set of users with proper in-app engagement.
Social media app retention rate
The retention rates of Social media application depends on a lot of factors such as seasonal trends in society, news, feature launches, etc. Engineering engagement as a feature will be a great way to retain users in-app, for example, how Instagram does it with “Reels”.
Day 1 Retention: 26.3%
Day 30 Retention: 3.9%
The average retention figures above reflect the average tendency of the majority of social media applications in number to provide a stellar user experience that is smooth. This could be across both the verticals of in-app feature functionalities or the community’s abilities within the application.
Dating app retention rate
The most interesting mobile application sector among Gen-Z today is dating but retention rates for dating apps don’t paint as pretty a picture.
Reasons are two-fold:
- A high number of users (especially in the male audience) don’t receive matches easily, after several tries, this can lead to churn
- Dating apps by design deliver value when their users get a match - and if they’re satisfied with the match, they will churn
Day 1 Retention: 29.6%
Day 30 Retention: 5.1%
To boost retention rate for a dating application, the number one thing will be to focus on reducing the time to find a date, or even just find a match.
How to improve mobile app retention rate
Before trying to improve retention (which is a very vague thing to do), it is necessary to ask which part of the retention curve we need to optimize because splitting retention curves into more actionable pieces will give you more actionable insights. There are 4 main components:
New User Experience
This can be the Day 1, Week 1, or Month 1 retention depending upon the natural usage frequency of your product. The crucial point here is that you have to make the users experience the core value (AHA moment) as quickly as possible.
By delivering the core value quickly and repeatedly delivering over the next few times the user uses the app, your users will be “activated”.
We talk more in depth about activation rates, you can check out our post on activation rates for mobile apps by industries if you’re curious.

Here are some strategies to improve the new user experience.
- User Onboarding: The onboarding process is a critical step in retaining users. It should be intuitive, and user-friendly, and guide users through the app’s features and functionality. Make sure it’s easy for users to register, set up their profile, and start using the app. Consider using tutorials or demos to help users get started.
- App Performance: App performance is crucial for a seamless new user experience. Ensure that the app runs smoothly, loads quickly, and doesn’t crash or freeze. Consider reducing app size or removing unnecessary features that may slow down the app.
- Selective acquisition: You might have a sub-par initial new user experience just because you’re acquiring the wrong users. Drill down on your acquisition channels, figure out where you get your best-fit users, and focus on those channels to improve pass-through for your new user experience.
Mid-term Retention
We all think that if we get the users to understand the product, the job has been done. But that’s not the case. It is necessary to create habits and rewire the user’s brain around the core value which exactly happens in this stage.

Below are some strategies to improve mid-term retention.
- Build triggers to reinforce habit: To help your users build a habit around your product, you need to create triggers that bring your users back to your app. For example, if you’ve set a daily learning frequency on Duolingo, the app reaches out with a push notification to remind you to complete your lesson for the day.
- In-app engagement: Engaging users within the app as they use it is necessary to increase retention. You can deliver hyper-personalized experiences and communication at scale to help your users take the right action at the right time, delivering higher value and improving retention. For showcasing these, different forms and shapes of in-app nudges can be used.
- Gamification: Use gamification elements such as badges, leaderboards, or rewards to motivate users. Consider incorporating mini-games or challenges within the app to keep users engaged. P.S. I’ve seen people using Snapchat every day just to maintain streaks.
- Personalization: Offer personalized recommendations or personalized notifications based on user preferences or past behavior to witness increased engagement. For example, Google PlayStore suggests mobile apps that are similar to what the user has previously downloaded.
Long-term Retention
In this stage, we need to get users to experience the core value as often as possible over a long period. Once looping the user into the habit, it is necessary to make the users invest in the habit over time.

Let’s take a look at a couple strategies to improve long-term retention.
- Community: Formation of communities around your product at the top of the funnel is a great way to retain your users and let them know about interesting features. This could be done via Newsletters, Slack, or Twitter Private Communities.
- Social media: Create a social media campaign aimed at addressing common customer complaints, such as rising prices or the removal of menu items, and use their feedback to rectify the situation and regain their loyalty.
Resurrection
The fourth and often overlooked retention component is resurrection or dormant users. This involves all the users which you have lost at a certain point and contemplating how to re-engage them.

Here’s how we can improve resurrection.
- Push Notifications: They are a powerful tool to re-engage users and remind them of the app’s value. They should be relevant, timely, and provide value to the user. But, push notifications to annoy users, causing frequent user churn, which should also be noted.
Frequently Asked Questions About Mobile App Retention Rates
What is a good D1 retention rate?
A good D1 (Day 1) retention rate typically ranges from 25-40% depending on your app category. E-commerce apps average 33.7% D1 retention, while gaming apps see 28-33%. Any D1 retention rate above 35% is considered exceptional. The key is comparing your performance against industry-specific benchmarks rather than overall averages.
What does 30-day retention rate mean?
30-day retention rate (also called D30 retention) measures the percentage of users who return to your app 30 days after their initial install. This is the industry-standard metric for app user retention because it indicates whether users have integrated your app into their regular routine. According to Adjust, the average 30-day retention rate across all apps is approximately 6%.
How do you calculate app use retention?
App use retention is calculated by dividing the number of users who remain active after a specific period by the total number of users who installed the app during that same timeframe, then multiplying by 100. The formula is: (Active Users on Day X / Total Installs on Day 0) × 100 = Retention Rate %. However, it’s crucial to define “active” based on meaningful engagement with your core value proposition, not just app opens.
What is the difference between retention rate and churn rate?
Retention rate measures the percentage of users who continue using your app, while churn rate measures the percentage who stop using it. They are inverse metrics: Churn Rate = 100% - Retention Rate. For example, if your D30 retention is 8%, your churn rate is 92%. Most companies track retention because it focuses on positive growth metrics rather than loss.
Why is retention rate more important than downloads?
According to research by Andrew Chen, 77% of users abandon apps within 3 days of install. This means acquisition without retention is simply buying users who will leave—making it unsustainable and expensive. Retention rate directly impacts lifetime value (LTV), which determines how much you can afford to spend on acquisition. Apps with high retention can outbid competitors because each user is worth more over time.
What retention rate indicates product-market fit?
According to Brian Balfour’s framework, product-market fit is indicated by a retention curve that flattens over time rather than declining to zero. While the exact percentage varies by industry, the pattern is more important than the number. If your retention curve continues dropping month after month without leveling off, you likely haven’t achieved PMF yet.
How does gamification improve app retention rates?
Gamification improves retention by creating habit loops and increasing user investment in your app. According to behavioral psychology research, gamification elements like streaks, badges, and leaderboards can increase D30 retention by 15-30%. These features work by triggering dopamine release, creating social motivation, and building sunk cost fallacy—making users less likely to abandon apps where they’ve invested time and achieved status.
How Plotline can help improve retention rates
To achieve sustainable growth, it is essential to establish a loyal customer base of long-term users. This requires prioritizing user retention and feature adoption at every step of the customer lifecycle.
So, to reduce the drop-offs andincrease the retention rate of users, strengthening the onboarding process and guiding them through the necessary user journey should be ensured.
This can be easily achieved using Plotline where the users experience the AHA moments faster which eventually leads to better retention.
Here’s how Plotline helps:
Cross-channel user journeys that drive retention
The challenge: Users interact with your app across multiple touchpoints- push notifications, in-app messages, emails, and more. Disconnected experiences across these channels lead to confusion and churn.
Plotline’s solution: Create seamless cross-channel user journeys that guide users from their first interaction to becoming power users. Coordinate messaging across push, in-app, email, and SMS to ensure users receive consistent, timely nudges that drive them toward your core value proposition.
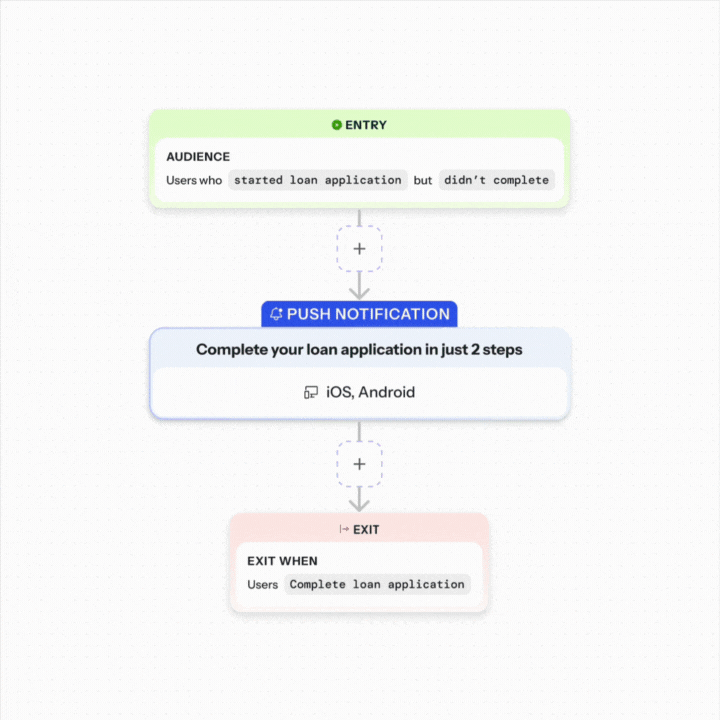
For example, if a user doesn’t complete onboarding:
- Day 1: In-app tooltip highlighting the key feature
- Day 2: Push notification reminding them to complete setup
- Day 3: Email with a quick-start guide
- Day 5: In-app modal offering one-on-one support
This coordinated approach ensures users don’t fall through the cracks during critical retention windows.
Gamification that builds lasting habits
The challenge: According to industry benchmarks, most apps lose 90% of users within 30 days. Building daily habits is essential for moving from new user retention to long-term retention.
Plotline’s solution: Deploy gamification elements without writing code. Create streaks, progress bars, achievement badges, and leaderboards that motivate users to return daily.
Real-world impact: Apps using gamification see 15-30% higher D30 retention rates because users develop emotional investment in maintaining their progress. Plotline makes it simple to:
- Launch streak counters that encourage daily usage
- Create milestone celebrations when users hit key achievements
- Build leaderboards that foster friendly competition
- Deploy progress tracking that shows users how far they’ve come
All of this happens without dev resources- meaning you can test, iterate, and optimize gamification strategies in days, not weeks.

Smart cross-sell and upsell that increase LTV
The challenge: High retention is only valuable if it translates to increased lifetime value. Many apps struggle to convert free users to paid or upgrade existing users to higher tiers without being pushy.
Plotline’s solution: Trigger intelligent cross-sell and upsell messages based on user behavior and engagement patterns. Instead of generic upgrade prompts, deliver contextual offers when users are most receptive:
- Feature gating nudges: When a free user tries to access a premium feature, show them exactly what they’ll unlock with an upgrade—in context, at the moment they want it.
- Usage-based upgrades: When users hit limits (storage, API calls, team members), present upgrade options with personalized messaging about their specific usage patterns.
- Success-triggered offers: After users complete key actions or achieve milestones, present premium features that enhance their success.
Real-world impact: According to D2C app benchmarks, well-timed upgrade prompts convert 3-5x better than generic paywall screens. Plotline lets you test different offer timing, messaging, and incentives to find what resonates with your users—all without waiting on dev cycles.
Ready to improve your app’s retention rate? Plotline helps product and growth teams launch personalized in-app experiences, cross-channel journeys, and gamification features in minutes- without code. Book a demo today.