App performance metrics are quantitative measurements that track how well your mobile application functions technically and how users engage with it, including speed, stability, user behavior, and business outcomes. These metrics help product teams identify issues, optimize user experience, and make data-driven decisions to improve app success.
TL;DR:
- App performance metrics measure technical quality (crash rates, load times), user engagement (DAU/MAU, session length), and business outcomes (LTV, conversion rates)
- Focus on 10-12 core metrics aligned with your business stage: early-stage apps prioritize engagement, mature apps emphasize revenue
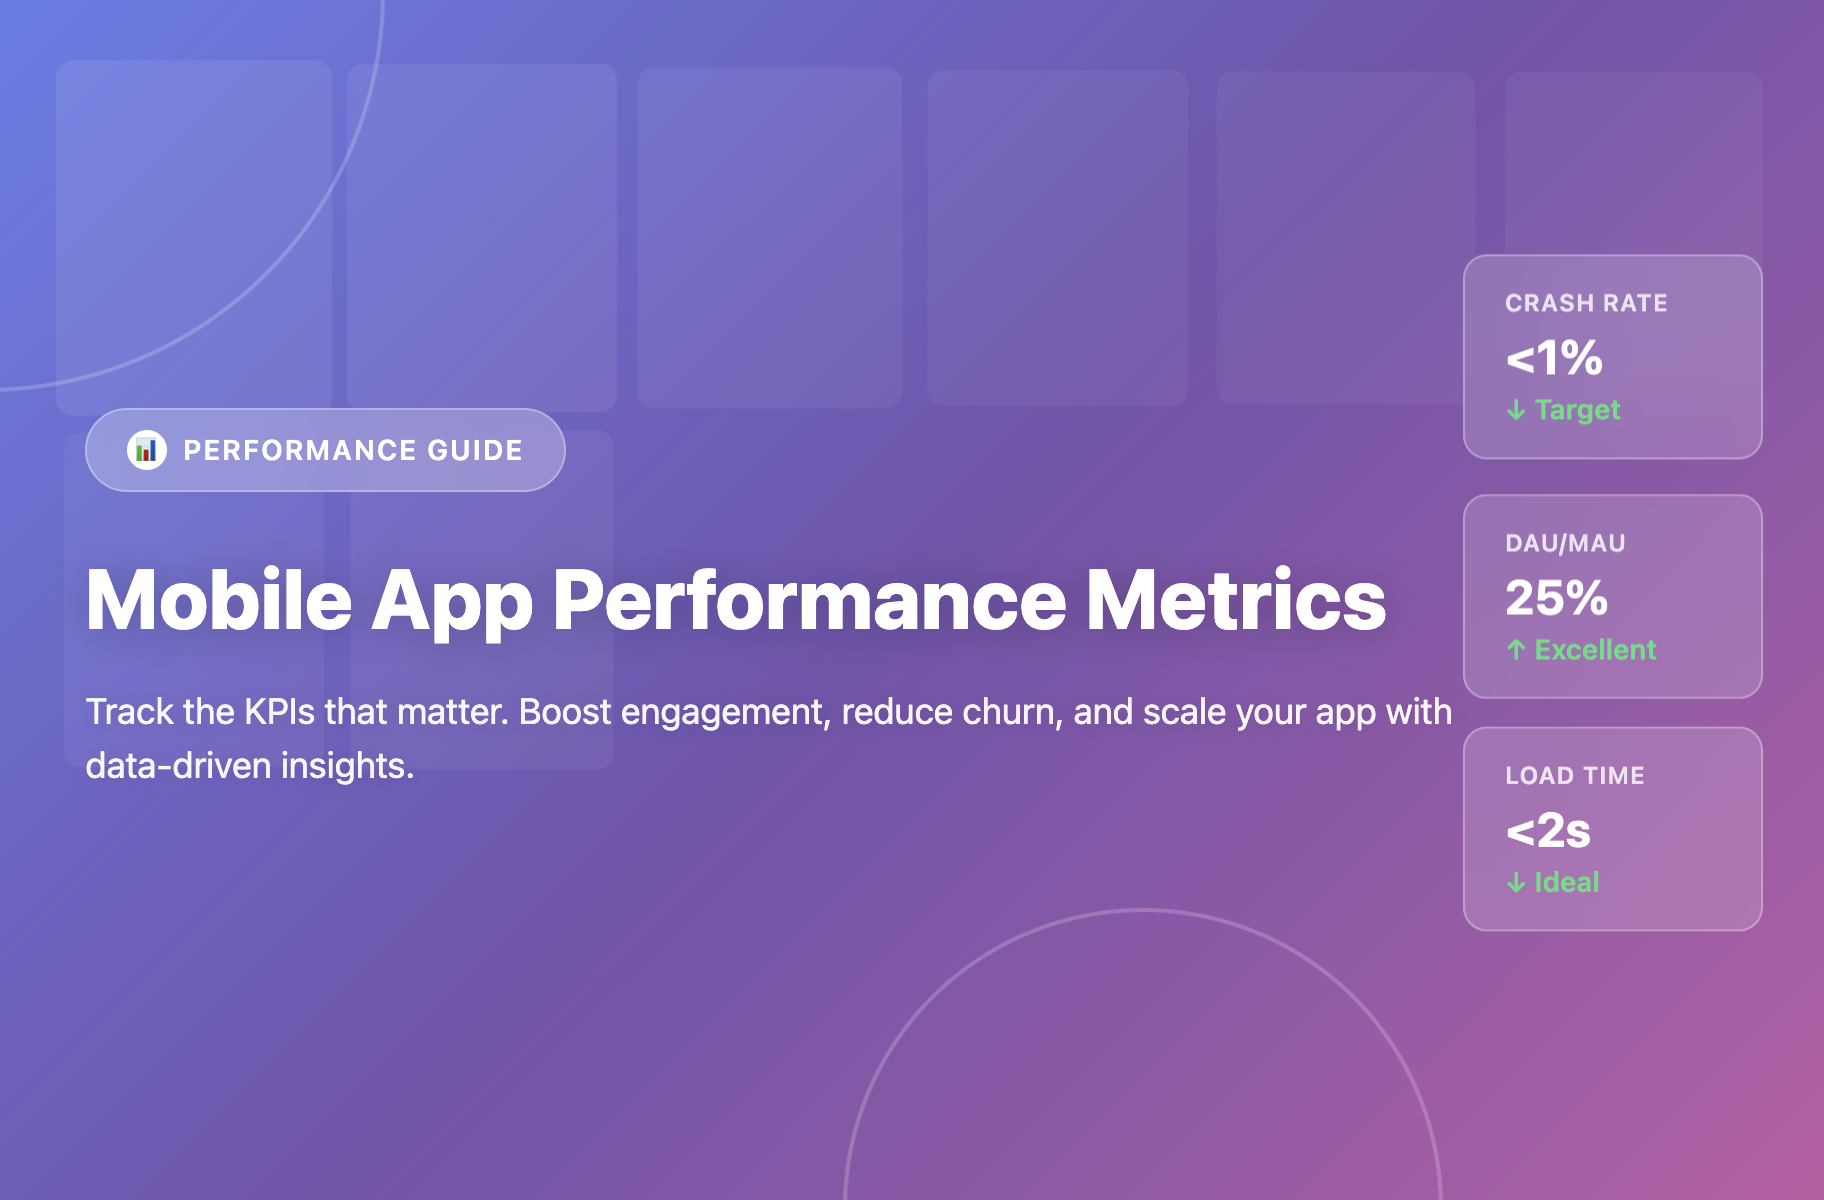
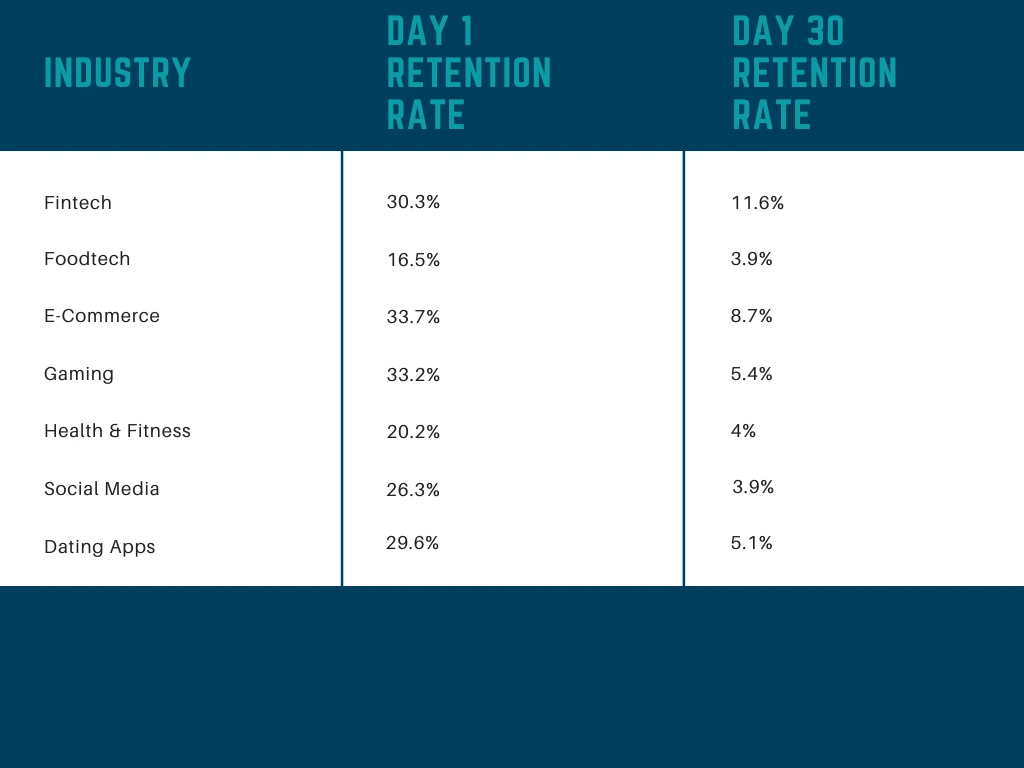
- Industry benchmarks: crash rates under 1%, load times under 2 seconds, DAU/MAU above 20%, Day 1 retention above 25%
- The right no-code tools can improve metrics without dev bottlenecks, launch optimizations in days, not weeks
What Are App Performance Metrics and Why Do They Matter?
Mobile app performance metrics are the measurable data points that reveal how your app is performing from both technical and user experience perspectives. According to recent industry data, 88% of users are unlikely to return after a bad experience, making performance tracking non-negotiable for success in 2026.
Think of app performance metrics as your app’s vital signs. These metrics fall into three categories:
Technical Performance (stability and speed)
User Engagement (how people interact with your app)
Business Metrics (revenue and growth).
The stakes are high - 62% of people uninstall an app if they experience crashes or errors, and apps face churn rates between 77-98% within the first 30 days.

Metrics vs KPIs: Understanding the Difference
App performance metrics are all measurable data points about your app. Key Performance Indicators (KPIs) are the subset that directly connects to your business goals. Not all metrics deserve equal attention—select KPIs aligned with your app’s stage and objectives, then track them consistently.
Essential Technical Performance Metrics
Technical metrics measure your app’s stability, speed, and efficiency. Poor technical performance drives users away regardless of feature quality.
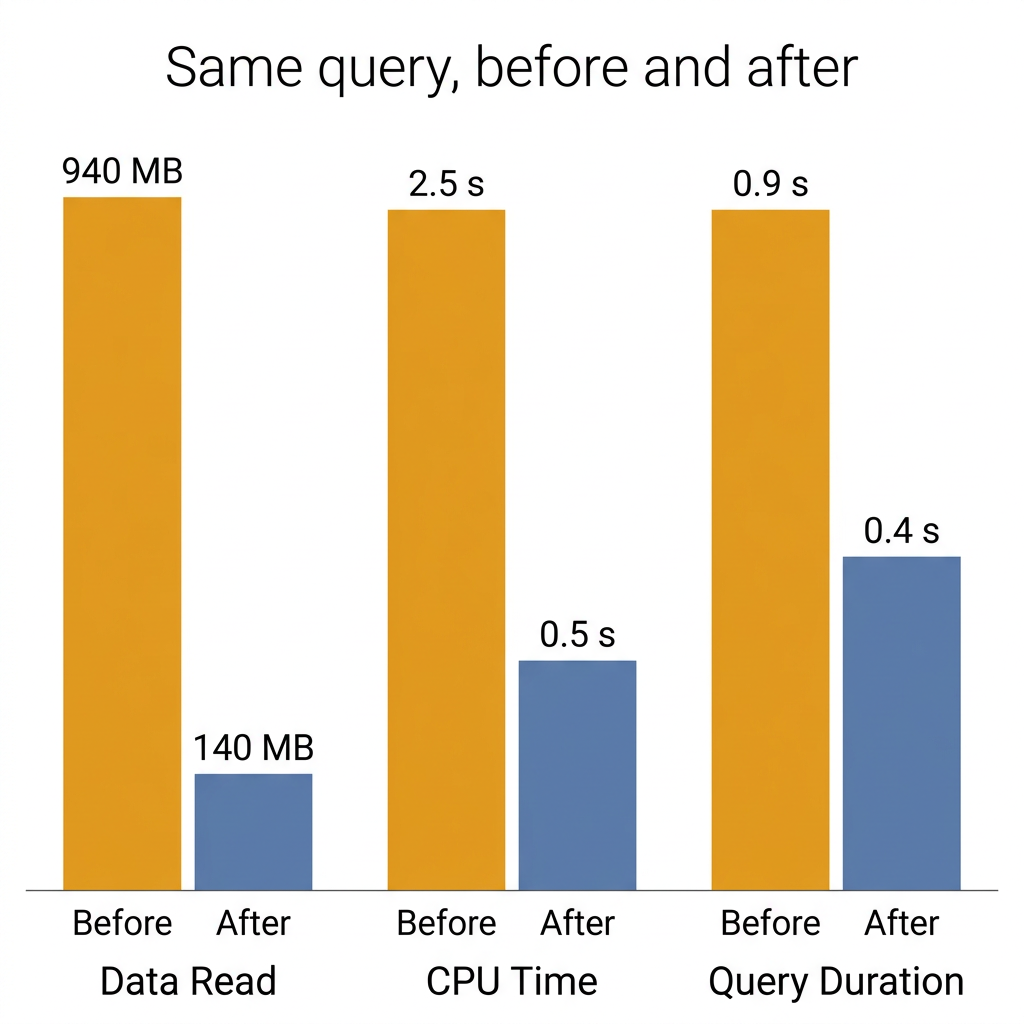
1. App Load Time / Startup Time
What it measures: Duration from when a user taps your app icon until the first usable screen appears.
Why it matters: First impressions are everything. A 2024 peer-reviewed study found that mobile apps with poor performance see an average 26% decrease in 30-day user retention.
Types to track:
- Cold start: App launches from scratch (slowest)
- Warm start: App resumes from background
- Hot start: App is already active (fastest)
Benchmark: Under 2 seconds is ideal. Anything over 3 seconds risks user frustration.
How to improve: Minimize initialization code, optimize network calls at startup, use lazy loading for heavy assets, and cache frequently accessed data.
2. Crash Rate / Crash-Free Sessions
What it measures: Percentage of app sessions that end in unexpected crashes.
Why it matters: Crashes destroy user trust and drive negative reviews. Every crash is a potential uninstall.
Benchmark: Aim for 98%+ crash-free users. The percentage of crash-free sessions averages 99.93% on iOS and 99.81% on Android. Leading apps maintain crash rates below 0.1%.
How to improve: Implement robust error handling, test extensively across devices, use beta testing programs, keep third-party libraries updated, and implement crash reporting tools like Crashlytics or Firebase.
3. App Responsiveness / API Latency
What it measures: How quickly your app responds to user interactions and API requests.
Why it matters: Users expect instant reactions. Delays create frustration and make apps feel sluggish. Network communication is a common source of degraded performance.
Benchmark: User interactions should respond in under 1 second. API calls should complete in under 200ms for critical operations.
How to improve: Optimize rendering performance, use asynchronous operations, implement caching strategies, batch API requests, and handle offline scenarios gracefully.
4. ANR (Application Not Responding) Rate
What it measures: Instances when your app becomes unresponsive to user input.
Why it matters: ANR events freeze your app, frustrating users. The average ANR rate on Android was 0.63%.
Benchmark: Keep ANR rate below 0.5% of sessions.
How to improve: Move long-running operations off the main thread, optimize database queries, and implement proper threading.
Critical User Engagement Metrics
Engagement metrics reveal whether users find value in your app. These determine if people stick around after the initial download.
5. Daily Active Users (DAU) and Monthly Active Users (MAU)
What they measure: Unique users who engage with your app daily (DAU) or over 30 days (MAU).
Why they matter: These are foundational health metrics. Growing DAU/MAUindicates an expanding, engaged user base. Declining numbers signal problems.

6. DAU/MAU Ratio (Stickiness)
What it measures: How frequently users return within a given period.
Calculation: Daily Active Users ÷ Monthly Active Users
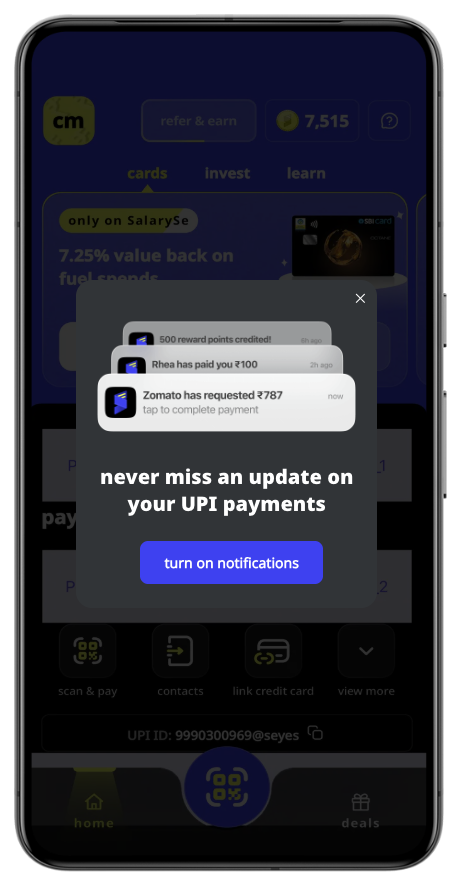
Why it matters: This ratio reveals habit formation. High ratios mean users return frequently—your app has become part of their routine.
Benchmark: 20% is good, above 25% is excellent.
How to improve: Create habit-forming features, send timely push notifications, deliver consistent value, and build community elements that encourage daily check-ins.
7. Session Length and Frequency
What they measure: Average time users spend per visit and how often they open your app.
Why they matter: Longer sessions suggest deep engagement, but context matters. Benchmarks vary by category—technology apps average 2.61 minutes per session while gaming apps average 7.55 minutes.
Important caveat: High session length doesn’t always mean success. Users might be struggling to complete tasks. Always correlate with conversion rates and satisfaction scores.
8. Feature Adoption Rate
What it measures: Percentage of users who actively use a specific feature.
Why it matters: Low adoption of key features signals discovery or usability issues. After analyzing over 100 companies, the average core feature adoption rateis 24.5%.
How to improve: Use in-app announcements to showcase features, create contextual tooltips, and simplify feature access.

Consumer apps have seen feature adoption increase by 40-60% through targeted in-app messaging. Product teams using Plotline can launch feature announcements and tooltips in hours - no dev resources needed.
Retention and Growth Metrics
Retention determines long-term viability. Acquiring users is expensive; keeping them is essential for sustainable growth.
9. User Retention Rate
What it measures: Percentage of users who return after their initial visit within specific timeframes.
Why it matters: Retention is often considered the most important indicator of product-market fit.
Key timeframes:
- Day 1 retention: Percentage returning the day after install
- Day 7 retention: Percentage returning within first week
- Day 30 retention: Percentage returning within first month
How to improve: Deliver value immediately during onboarding, implement personalized experiences, use push notifications strategically, and address friction points in the user journey.
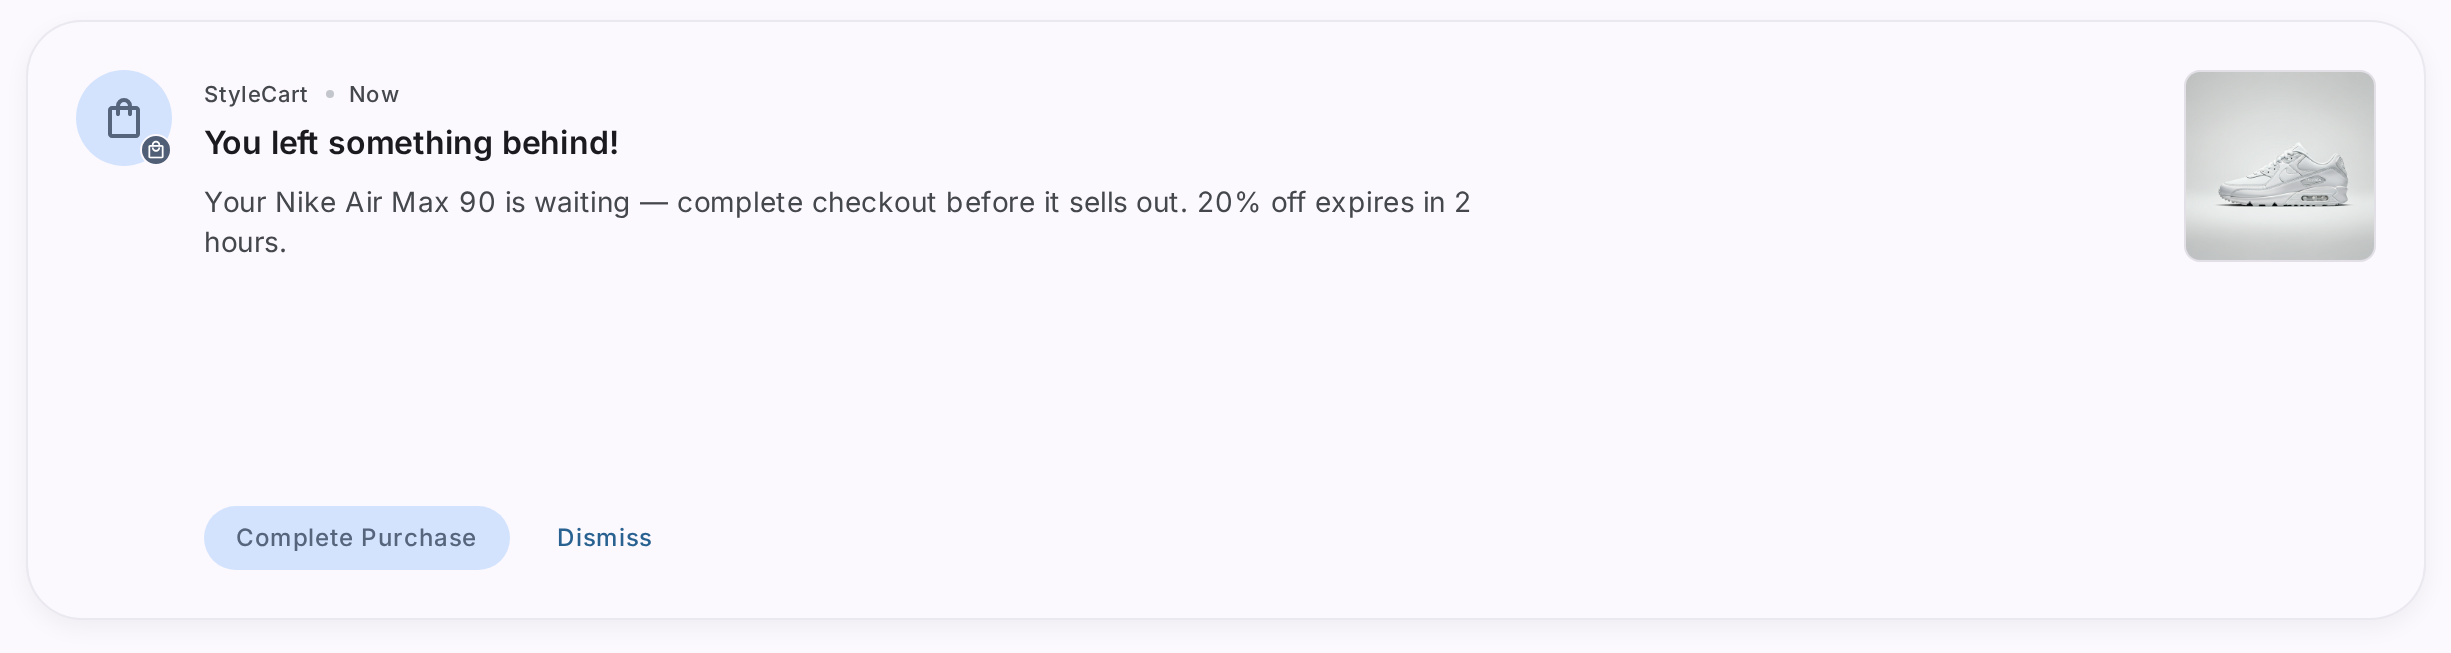
10. Churn Rate
What it measures: Percentage of users who stop using your app over a given period.
Why it matters: Churn is the inverse of retention. High churn indicates users aren’t finding sustained value. Acquiring new users costs significantly more than retaining existing ones.
How to improve: Identify churn signals through behavior analysis, implement win-back campaigns, gather exit feedback, and continuously improve core value propositions.
Revenue and Business Metrics
Business metrics connect app performance to financial sustainability. These KPIs determine commercial viability.
11. Customer Lifetime Value (LTV)
What it measures: Total revenue expected from a single customer throughout their relationship with your app.
Why it matters: LTV helps you understand long-term returns and guides budget allocation. If LTV is declining, you’re losing monetization efficiency.
How to improve: Extend user engagement duration, increase revenue per user through upselling, improve retention, and optimize in-app purchase flows.
12. Customer Acquisition Cost (CAC)
What it measures: Total cost of acquiring a new customer, including ad spend and marketing expenses.
Why it matters: CAC must remain lower than LTV for profitability. In 2026, iOS CPIs average $3.50 compared to $2.70 for Android.
How to reduce: Refine targeting parameters, optimize ad creative through A/B testing, leverage lower-cost channels, implement referral programs, and improve conversion rates.
13. Conversion Rate
What it measures: Percentage of users who complete a desired action—signing up, making a purchase, or subscribing.
Why it matters: Conversion rate reveals how effectively your app turns visitors into paying customers. In-app purchase conversion rates are often below 5%, making optimization crucial.
How to improve: Streamline checkout flows, reduce signup friction, use social proof, implement strategic messaging at conversion points, and test different pricing structures.
How to Track App Performance Metrics in 2026
Choose Metrics Based on Your App Stage
Early-stage apps (0-6 months):
- Prioritize: DAU/MAU, session length, feature adoption, crash rates, load times
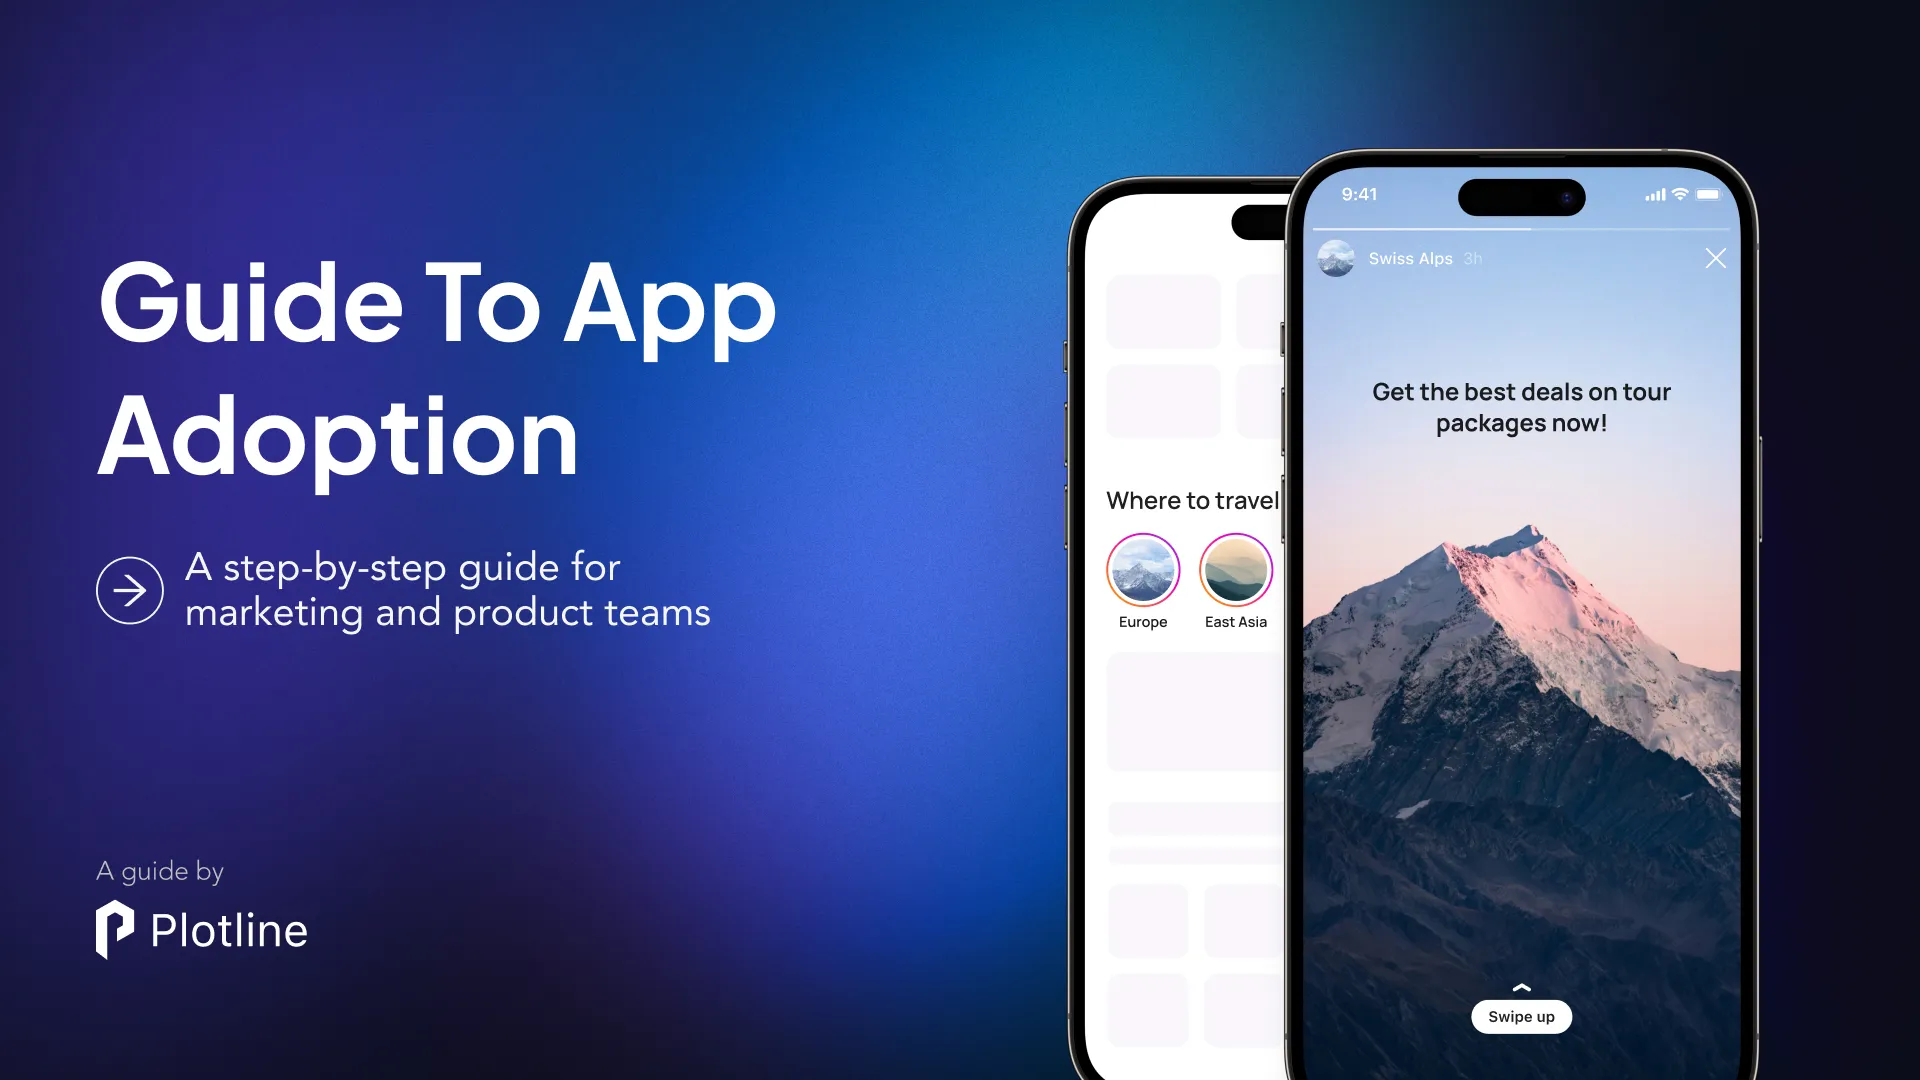
Download your guide to app adoption to understand more about how consumer apps can improve new user activation, cross and up-sell to drive app growth.
Growth-stage apps (6-24 months):
- Emphasize: Day 1/7/30 retention, conversion funnels, push notification performance
Mature apps (24+ months):
- Focus on: LTV, CAC, ARPU, churn reduction, customer satisfaction
Essential Tools for Tracking
Analytics platforms:
- Firebase (comprehensive, free tier)
- Mixpanel (event-based tracking)
- Amplitude (product analytics)
Performance monitoring:
- Firebase Performance Monitoring
- Crashlytics (crash reporting)
- New Relic (APM tools)
Engagement optimization:
- Plotline (no-code in-app experiences)
- Braze (cross-channel messaging)
Set Benchmarks and Alerts
Know what “good” looks like for your app category, then monitor for deviations.
Technical benchmarks:
- Crash rate: Under 1%
- Load time: Under 2 seconds
- API response: Under 200ms
- ANR rate: Under 0.5%
Engagement benchmarks:
- DAU/MAU: Above 20%
- Day 1 retention: Above 25%
- Feature adoption: 24.5% average
Set automated alerts for critical metrics. If crash rates spike above 2% or retention drops suddenly, your team needs immediate notification.
Avoid Common Mistakes
Don’t track vanity metrics. Downloads sound impressive, but if users don’t stick around, they’re meaningless. Focus on retention and engagement.
Don’t ignore context. High session length might indicate engagement—or users struggling to complete tasks. Always investigate the “why.”
Don’t react to short-term fluctuations. Look at trends over weeks and months, not daily variations.
Don’t track without acting. Metrics should drive decisions. If you’re not using data to improve, you’re wasting time collecting it.
How Plotline Improves App Performance Metrics
Most apps struggle with low engagement and feature adoption because users don’t discover features or understand their value. Traditional solutions require engineering sprints - Plotline changes the equation.
Boost Feature Adoption Without Dev Resources
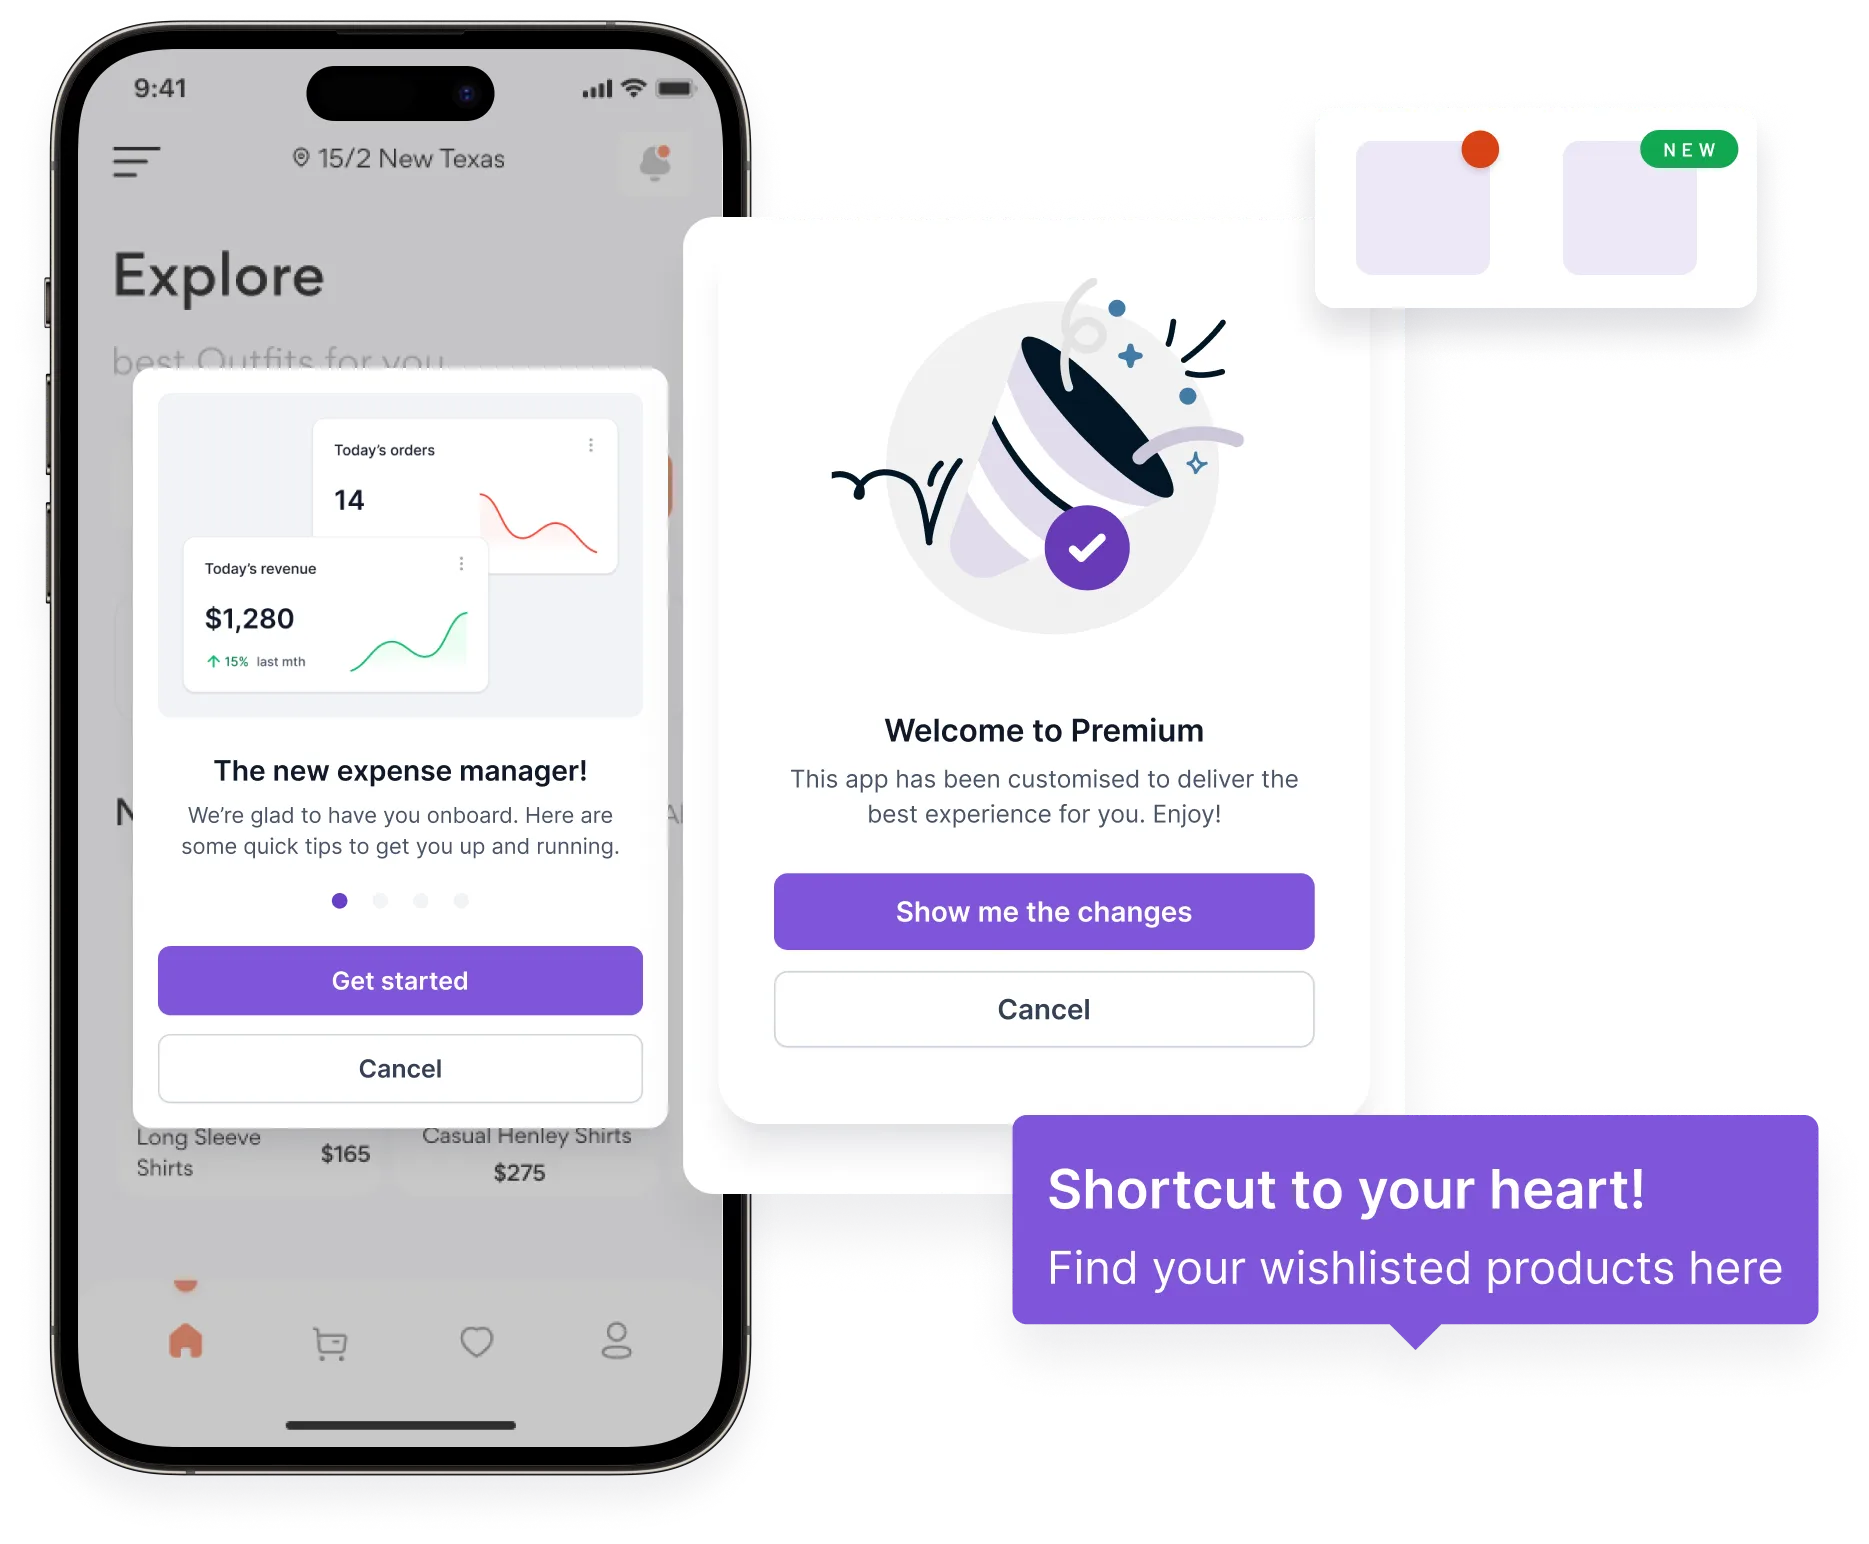
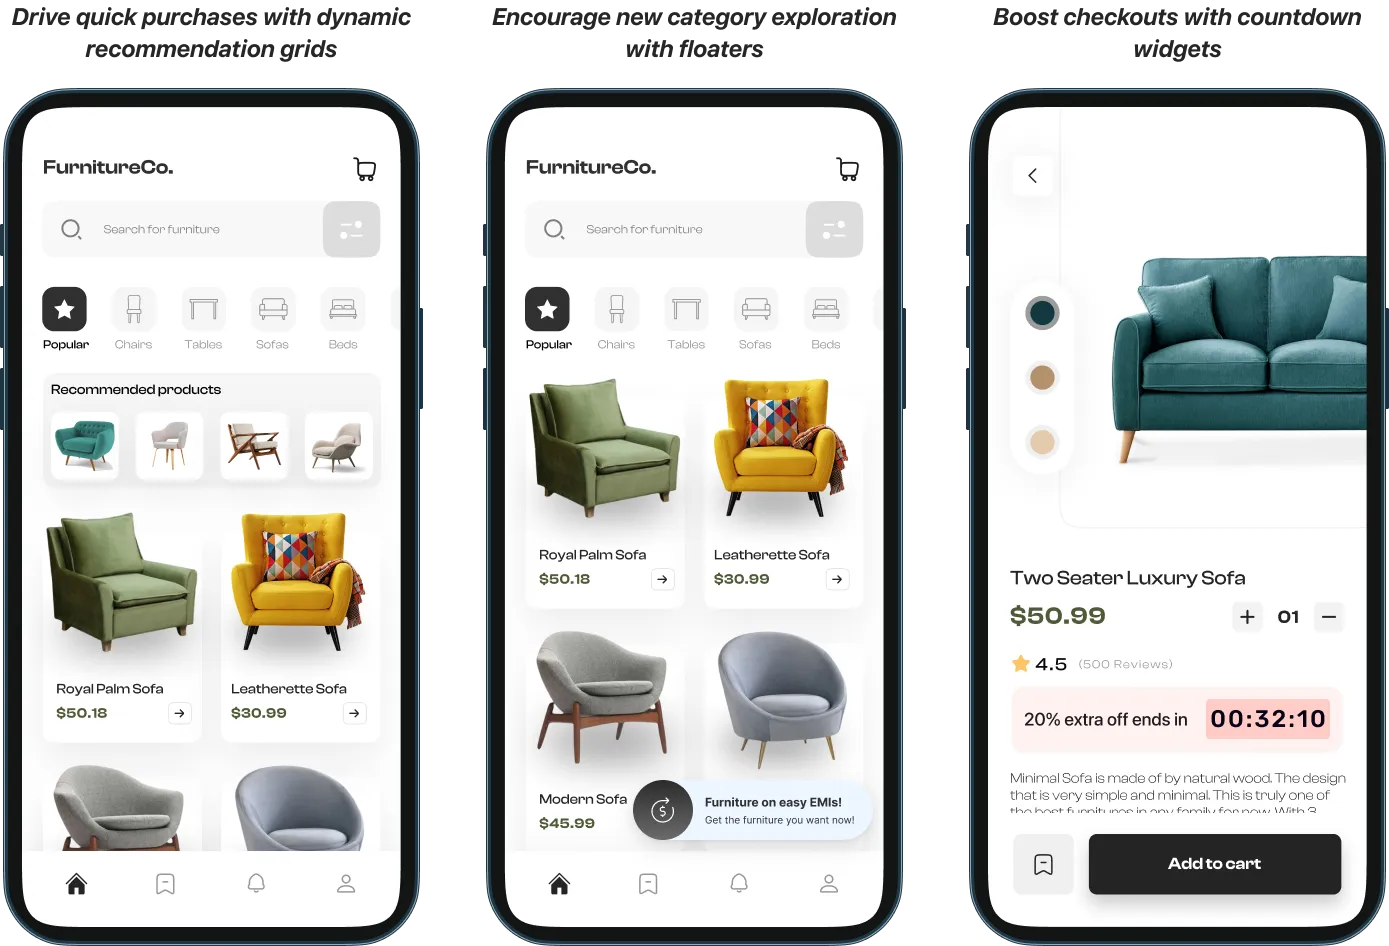
No-code in-app messaging: Create feature announcements, tooltips, and tutorials without touching code. Launch contextually relevant messages based on user behavior.
Reduce Churn with Timely Interventions
Plotline enables product teams to create personalized re-engagement flows triggered by user behavior—showing messages when users haven’t completed key actions or exhibit churn signals.
Improve Onboarding and Retention
Poor onboarding is a retention killer. Plotline helps teams create seamless onboarding experiences through progressive disclosure and contextual help.
Optimize Without Waiting on Engineering
Plotline lets product teams iterate independently, launching new in-app experiences with contextual nudges and seeing results within hours. A/B testing is built-in, changes deploy instantly, and no app updates are required.
Summary
The most critical metrics span technical performance (crash rates under 1%, load times under 2 seconds), user engagement (DAU/MAU above 20%, strong feature adoption), retention (minimizing churn within first 30 days), and business outcomes (LTV exceeding CAC, healthy conversion rates).
Focus on 10-12 core KPIs aligned with your app’s stage and business objectives. Early-stage apps should prioritize engagement and stability, while mature apps need to emphasize revenue and efficiency.
Success requires three elements: comprehensive monitoring through analytics tools, actionable insights from regular metric reviews, and the ability to act quickly on findings.
Modern no-code platforms like Plotline enable product teams to improve metrics without waiting on engineering resources - launching contextual nudges, onboarding flows, and re-engagement campaigns in hours instead of weeks. As mobile apps continue dominating consumer engagement, the apps that win will measure relentlessly, optimize continuously, and move fast to deliver exceptional user experiences.
Ready to improve your app performance metrics without the dev bottleneck? Plotline helps consumer apps boost engagement, reduce churn, and increase feature adoption - all without writing a single line of code. See how leading apps are shipping faster and moving metrics with Plotline.