
Mobile app engagement metrics are quantitative measurements that track how users interact with your application, including frequency of use, session duration, feature adoption, and retention patterns. These metrics help product teams understand user behavior, identify improvement opportunities, and make data-driven decisions to boost long-term engagement and revenue.
TL;DR:
- Engagement metrics measure user interaction patterns, from daily active users and session length to feature adoption and retention rates
- Focus on 10-12 core metrics aligned with your app category: social apps prioritize DAU/MAU, e-commerce tracks conversion rates, finance apps emphasize retention
- Key benchmarks: DAU/MAU ratio above 20%, 30-day retention between 27-43%, average session length 5+ minutes
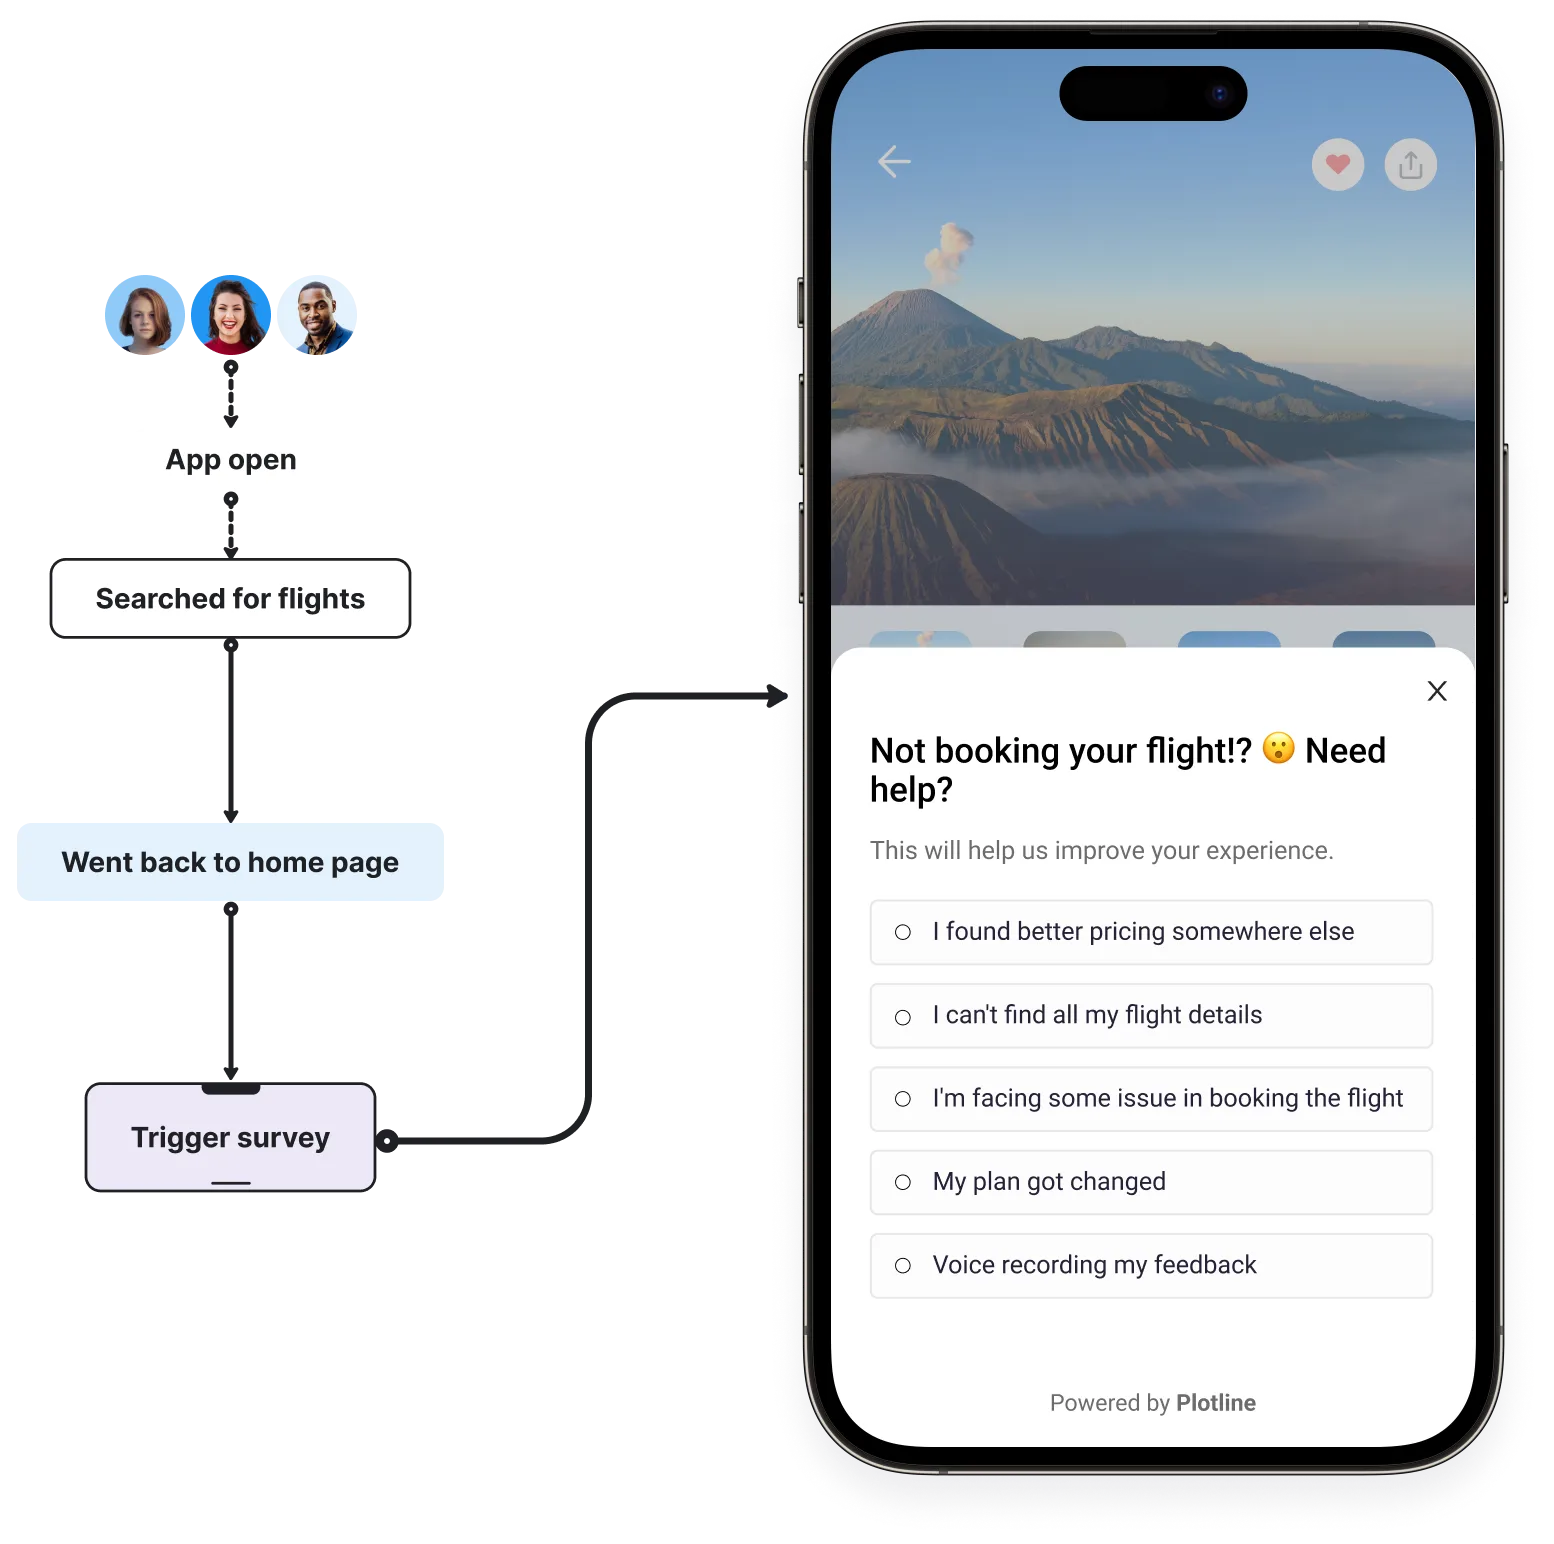
- Use no-code tools like Plotline to improve engagement metrics in hours instead of weeks, no dev resources required
What Are Mobile App Engagement Metrics and Why Do They Matter?
Mobile app engagementmetrics are data points that reveal how users interact with your app beyond simple downloads. They measure how often people open your app, how long they stay, which features they use, and whether they return. According to industry research, with over 99,000 Android apps and 36,000 iOS apps released every month, understanding engagement is the only way to stand out in a crowded market.
These metrics matter because downloads alone don’t guarantee success. You could have millions of installs, but if users open your app once and never return, you’ve failed. Engagement metrics show whether your app delivers real value and becomes part of users’ routines. High engagement translates directly to better retention, higher revenue, and sustainable growth.
The stakes are clear: the average 30-day retention rate across industries sits between 27% and 43%, meaning most apps lose over half their users within a month. Without tracking engagement metrics, you won’t know why users leave or what keeps them coming back. These insights guide everything from product development to marketing campaigns, helping you build an app people actually want to use.
Understanding Different Types of Engagement Metrics
Engagement metrics fall into several categories, each revealing different aspects of user behavior.
User Activity Metrics like DAU and MAU show how many people actively use your app and how often they return. These are your baseline health indicators—growing active users signal product-market fit.
Session Metrics including session length, frequency, and interval reveal how deeply users engage during each visit and how quickly they come back. These metrics expose whether your app has become habit-forming.
Retention and Churn Metrics track whether users stick around over time or abandon your app. These are perhaps the most critical for long-term success, as retaining users is far cheaper than acquiring new ones.
Feature and Conversion Metrics show which functionalities users actually adopt and whether they complete desired actions like purchases or sign-ups. These connect engagement to business outcomes.
What qualifies as “good” engagement depends entirely on your app category. A social media app should see daily usage and long sessions, while a banking app might have brief but frequent interactions. A travel booking app experiences seasonal spikes rather than consistent engagement. Context is everything when interpreting these metrics.
Essential Mobile App Engagement Metrics to Track
1. Daily Active Users (DAU) and Monthly Active Users (MAU)

What they measure: The number of unique users who engage with your app daily (DAU) or over a 30-day period (MAU).
Why they matter: DAU and MAU are foundational metrics that show whether your user base is growing, stable, or declining. They provide a snapshot of app health and help you understand engagement patterns over time. These metrics are particularly critical for apps where regular usage indicates success, like social media, news, or productivity tools.
How to track them: Analytics platforms like Google Analytics, Mixpanel, and Firebase automatically calculate DAU and MAU. A user counts as “active” when they open the app and perform any meaningful action, though you define what “meaningful” means for your app.
Industry context: DAU and MAU importance varies by category. Social apps like Instagram rely heavily on daily engagement for ad revenue, while healthcare apps focus more on patient outcomes than daily usage. Food and drink apps typically have lower monthly open rates compared to news or social apps.
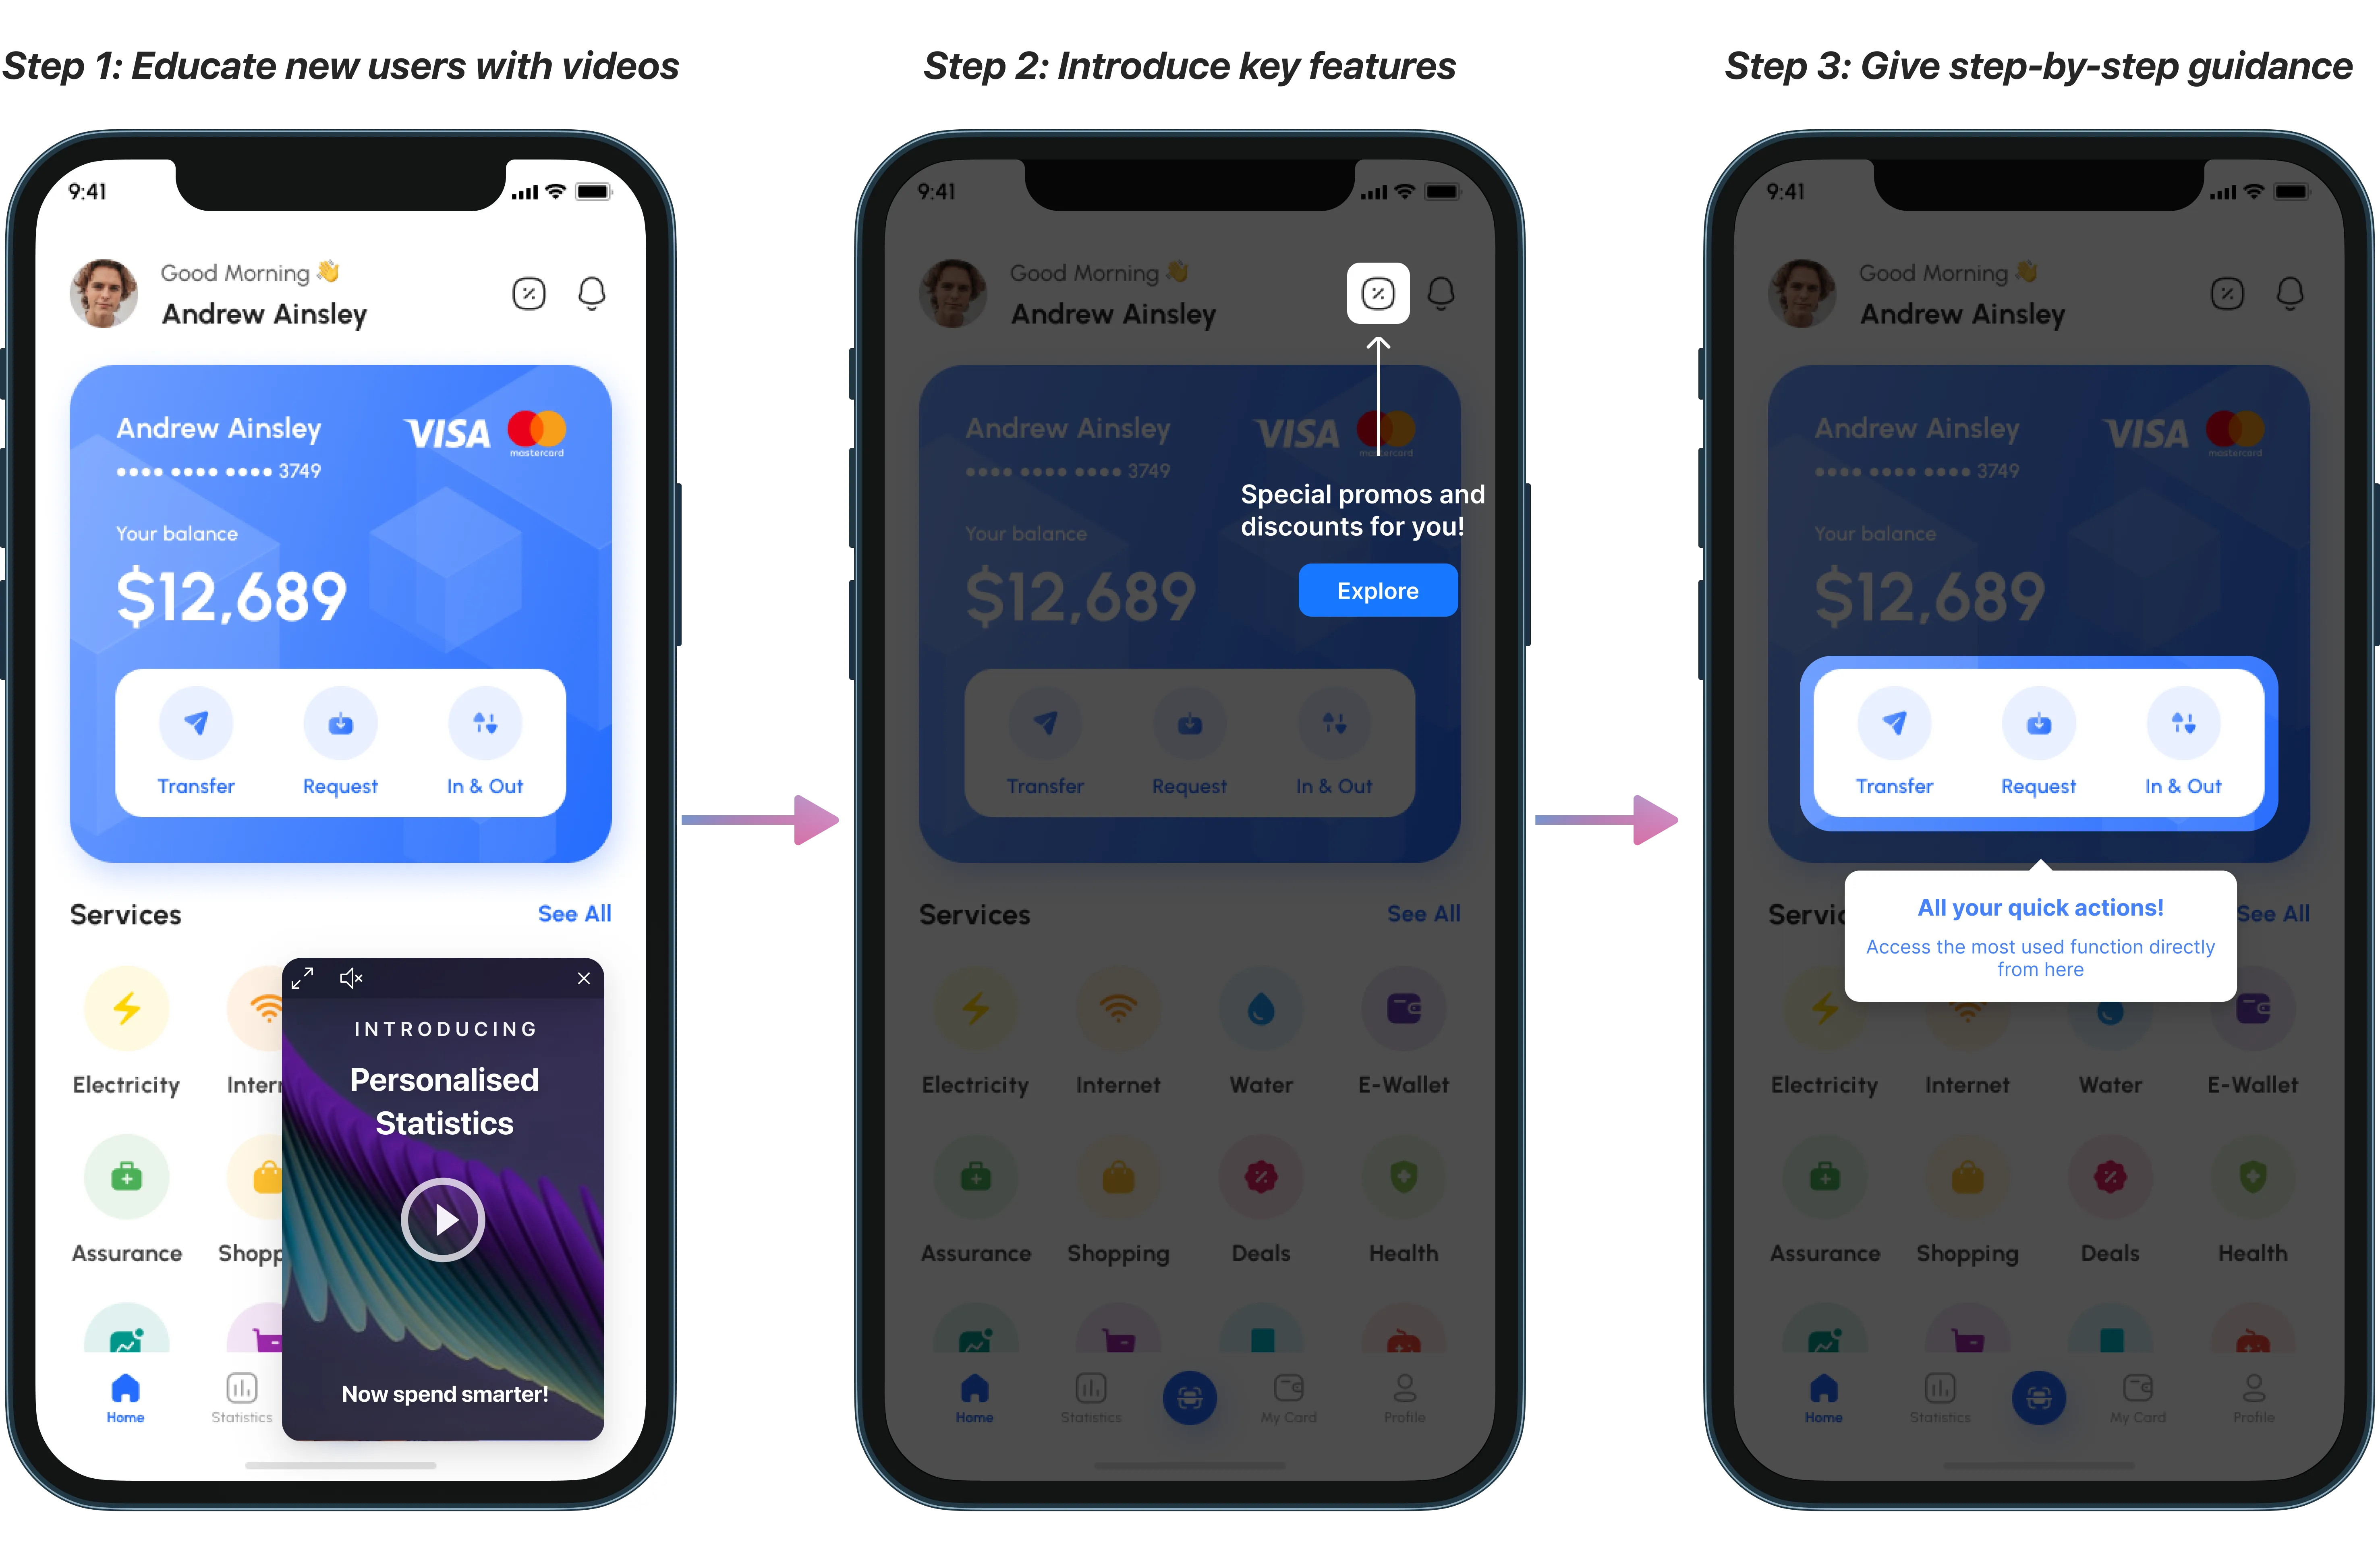
How to improve: Send strategic push notifications to remind inactive users of your app’s value, personalize content to make the app more relevant to individual users, add features that encourage daily check-ins, and optimize onboarding to help users find value quickly.
2. DAU/MAU Ratio (Stickiness)
What it measures: How frequently users return to your app within a given period, calculated by dividing DAU by MAU and expressing as a percentage.
.webp)
Why it matters: Stickiness reveals whether your app has become part of users’ routines. A high ratio means users don’t just install your app—they use it regularly. This metric directly correlates with retention and long-term value. Research from Mixpanel shows that the average stickiness across industries is 37%.
Benchmark: 20% is considered good, meaning one in five monthly users engages daily. Anything above 25% is excellent and indicates strong habit formation.
How to calculate: If you have 2,000 daily active users and 10,000 monthly active users, your stickiness is 20%.
How to improve: Implement gamification elements that reward daily usage, create personalized experiences that make users feel the app is tailored to them, use timely notifications that add value rather than annoy, build social or community features that give users reasons to return, and ensure core features are easily accessible.
3. Session Length (Average Session Duration)
What it measures: The average amount of time users spend actively engaged in your app during a single visit, from opening to closing.
Why it matters: Session duration indicates how deeply users engage with your content or features. Longer sessions often suggest users find your app valuable and immersive. However, context is critical—extended sessions in a navigation app might indicate confusion rather than engagement.
Industry benchmarks: The average session length on mobile devices is around five minutes, but this varies dramatically by category. Entertainment apps average seven minutes, gaming apps can see much longer sessions, while utility apps typically have brief interactions.
Important caveat: High session length doesn’t automatically mean success. Product leaders have reported situations where session duration increased because users struggled to understand features or faced technical issues. Always correlate session length with other metrics like conversion rates and user satisfaction.
How to improve: Create engaging content that encourages exploration, reduce friction in user flows so people can accomplish tasks efficiently, implement features that naturally extend engagement (like autoplay or recommendations), and use in-app messaging to guide users toward valuable features.
4. Session Frequency
What it measures: How often users open and interact with your app over a given period.
Why it matters: Session frequency reveals usage patterns and habit formation. Users who return frequently demonstrate that your app provides ongoing value. This metric helps you understand whether your app is a daily necessity, a weekly tool, or an occasional resource.
Category differences: Sports apps see the highest monthly open rates, while food and drink apps along with shopping apps are opened less frequently. News and magazines have the highest percentage of users engaging once per day.
How to improve: Build features that require or benefit from regular interaction, send notifications at optimal times when users are most likely to engage, create streaks or consistency rewards that incentivize daily usage, and ensure your app loads quickly to reduce friction for frequent users.
5. Session Interval
What it measures: The time elapsed between consecutive app sessions, revealing how quickly users return after their last visit.
Why it matters: Session interval provides a different lens on engagement by measuring re-engagement speed. Shorter intervals indicate your app is top-of-mind and users feel compelled to return quickly. This metric is particularly valuable for apps designed for frequent use.
How to use it: Combine session interval with session frequency and duration for a comprehensive engagement picture. A user who returns every few hours with brief sessions shows different behavior than someone with weekly sessions lasting 30 minutes.
How to improve: Time push notifications based on typical session intervals to catch users when they’re likely to engage, create features that benefit from frequent check-ins (like limited-time offers or real-time updates), ensure your app provides enough value that users want to return soon, and reduce any technical issues that might discourage quick returns.
6. Retention Rate
What it measures: The percentage of users who return to your app after their initial visit, typically measured at Day 1, Day 7, and Day 30.
Why it matters: Retention is often considered the single most important engagement metric. It reveals whether users find lasting value in your app. High retention translates to more revenue as existing users continue paying and potentially expand their accounts. Research shows that the average 30-day retention rate varies between 27% and 43% depending on industry, with high-performing apps achieving 32% to 66%.

Key timeframes:
- Day 1 retention: Measures immediate value—did users come back the next day?
- Day 7 retention: Shows whether your app survived the initial trial period
- Day 30 retention: Indicates long-term stickiness and habit formation
Bounded vs unbounded retention: Bounded retention tracks users returning on specific days (exactly Day 7), while unbounded retention measures users returning at any point (anytime during the first week). Unbounded provides a broader view of loyalty over time.
How to improve: Optimize onboarding to deliver value immediately, implement personalized experiences based on user behavior, use strategic push notifications to re-engage users before they churn, identify friction points in the user journey and eliminate them, and continuously refine core features based on usage data.
Plotline impact: Food delivery apps using Plotline have reduced Day 7 churn by 23% through targeted in-app messaging that re-engages users who haven’t ordered in 3 days with personalized offers and reminders.
7. Churn Rate
What it measures: The percentage of users who stop using your app over a specific period, calculated as the number of users lost divided by total users at the start.
Why it matters: Churn is retention’s inverse and equally critical. High churn means you’re constantly losing users, forcing you to spend more on acquisition just to maintain your user base. Since acquiring new users costs significantly more than retaining existing ones, minimizing churn is essential for profitability.

Common causes: Poor onboarding that doesn’t demonstrate value quickly, incomplete functionality that fails to meet user needs, bad user experience including crashes or slow performance, lack of ongoing engagement through notifications or new content, and better alternatives from competitors.
How to improve: Identify at-risk users through behavior analysis (like declining session frequency), create win-back campaigns targeting users who haven’t engaged recently, gather exit feedback to understand why users leave, improve onboarding to establish value before users churn, and continuously enhance features based on user needs.
Re-engagement strategies: Use tools like Plotline to trigger personalized messages when users show churn signals, send targeted offers to inactive users, implement lifecycle campaigns that nurture users through different stages, and make it easy for churned users to reactivate.
8. Feature Adoption Rate
What it measures: The percentage of users who actively engage with a specific feature, calculated by dividing users engaging with the feature by total active users.
Why it matters: This metric reveals which functionalities resonate with users and which need improvement. Low adoption of key features signals discovery or usability issues. After analyzing over 100 companies, research found that the average core feature adoption rate is 24.5%.
Discovery vs engagement: High discovery with low engagement suggests users find the feature but don’t see value. Low discovery means users don’t know the feature exists—a common problem that in-app messaging solves.
How to track: Monitor adoption rate when launching new features to gauge success, segment by user cohort to see which groups adopt features, and track feature usage over time to identify trends.
How to improve: Use in-app announcements to showcase new features when users are most likely to need them, create contextual tooltips that explain feature benefits, simplify feature access to reduce friction, and gather feedback on feature utility through in-app surveys.
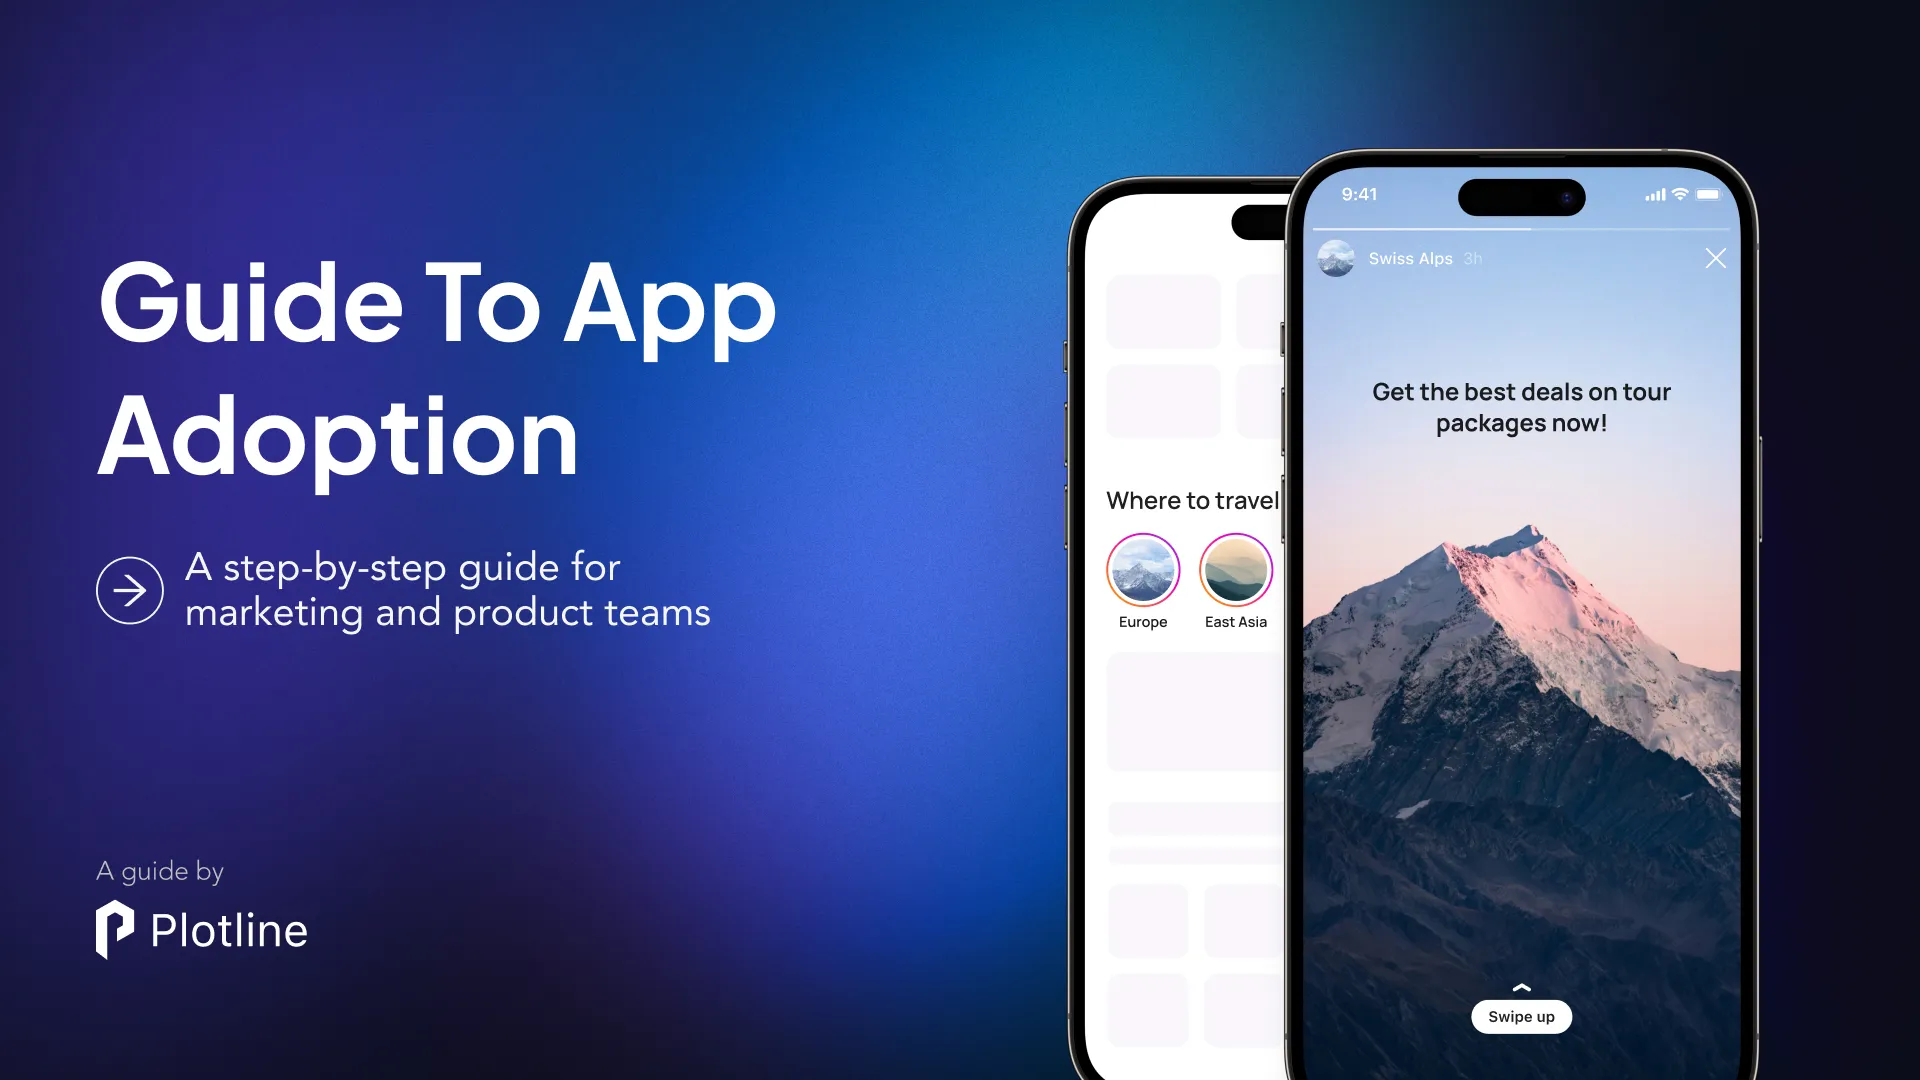
Download our guide to app adoption to understand more about how contextual nudges can improve onboarding, up sell and cross sell to boost feature adoption.
Plotline advantage: Product teams using Plotline can launch feature announcements and contextual walkthroughs in hours with no coding required. Consumer apps have seen feature adoption increase by 40-60% simply by making features more discoverable through targeted in-app messaging. A leading fintech app used Plotline to announce a new investment feature and saw adoption jump 47% within two weeks.
9. Conversion Rate
What it measures: The percentage of users who complete a desired action within your app, such as making a purchase, signing up for a subscription, completing a level, or any other goal you define.
Why it matters: Conversion rate directly connects engagement to business outcomes. High engagement means nothing if users don’t convert. This metric helps you understand how effectively your app guides users toward valuable actions and identifies friction points in conversion funnels.
Common conversion actions:
- E-commerce: Completing purchases, adding items to cart, initiating checkout
- Subscription apps: Signing up for paid plans, upgrading from free accounts
- Gaming apps: Completing levels, making in-app purchases, daily login streaks
- Social apps: Creating content, following users, sharing posts
How to improve: Streamline conversion flows by removing unnecessary steps, reduce friction in checkout or signup processes, use social proof like user reviews or popularity indicators, implement strategic messaging at conversion points, A/B test different layouts and copy, and ensure fast loading times during critical conversion moments.
10. Customer Lifetime Value (LTV)
What it measures: The total revenue you expect to generate from a single user throughout their entire relationship with your app.
Why it matters: LTV connects engagement metrics to financial sustainability. It helps you understand long-term returns from user acquisition and determines how much you should spend to acquire each user. If LTV is declining, your engagement and monetization strategies need work.
Key factors in LTV calculation: Transaction frequency (how often users make purchases), transaction value (how much they spend per purchase), and customer lifespan (how long they remain active, considering both churn and loyal users).
Relationship to engagement: Higher engagement typically leads to higher LTV. Users who visit frequently, engage deeply, and adopt multiple features tend to spend more over time. This is why improving engagement metrics ultimately drives revenue growth.
How to improve LTV: Extend user engagement duration through better retention strategies, increase revenue per user by optimizing pricing and upselling, improve feature adoption so users extract more value, create loyalty programs that reward long-term users, and continuously enhance the user experience to reduce churn.
11. Exit Rate (Bounce Rate)
What it measures: The percentage of users who exit your app from a specific screen, calculated by dividing total exits from that screen by visits to that screen.
Why it matters: Exit rate helps you pinpoint exactly where users lose interest or encounter problems. Recent data suggests an average exit rate of around 9% is expected, so anything significantly higher on specific screens indicates issues that need addressing.
How to use it: Identify screens with abnormally high exit rates, investigate what might cause users to leave at those points (confusing UI, missing information, technical issues), prioritize fixes for screens with the highest exit rates that impact key user journeys, and test improvements to see if exit rates decrease.
How to improve: Simplify navigation on high-exit screens, ensure all necessary information is easily accessible, remove technical bugs or slow-loading elements, clarify next steps with better calls-to-action, and use in-app messaging to guide users through complex flows.
12. Average Revenue Per User (ARPU)
What it measures: The average revenue generated from each active user, calculated by dividing total revenue in a period by total active users during that period.
Why it matters: ARPU reveals monetization effectiveness per user. Increasing ARPU means you’re extracting more value from your existing user base, which is often easier than acquiring new users. Industry benchmarks show non-gaming iOS apps average $8.39 ARPU compared to $1.54 for Android apps, highlighting platform differences.
How to improve: Evaluate and optimize pricing strategies, implement strategic upselling for premium features, introduce tiered subscription options, optimize in-app purchase placement to increase visibility, personalize offers based on user behavior and value, and ensure conversion flows are frictionless.
How Engagement Metrics Differ by App Category
Understanding your app category helps set realistic benchmarks and optimization strategies.
Social media and messaging apps: Expect daily usage with high DAU/MAU ratios (often 40%+). Session frequency is critical, and users typically spend 40+ minutes per day across multiple sessions. Focus on features that encourage social connection and habit formation.
E-commerce and shopping apps: Engagement follows purchase cycles and seasonal trends. Session length is typically brief but conversion-focused. Lower session frequency is normal, so retention depends on delivering value during shopping intent moments. Personalized recommendations drive both engagement and revenue.
Finance and banking apps: High retention due to essential daily use and trust in security. Sessions are brief but frequent as users check balances or make transactions. Focus on security, reliability, and convenience. Users expect the app to work perfectly every time.
Entertainment and streaming apps: Longest average session lengths (7+ minutes for entertainment, even longer for streaming). Engagement patterns vary by content availability and user preferences. Autoplay and recommendations are critical for maintaining engagement.
Health and fitness apps: Engagement challenged by user motivation and seasonal trends (New Year spikes). Short workouts and wearable integration boost retention. Gamification and social features help maintain long-term engagement.
Productivity and utility apps: Brief but frequent sessions focused on completing specific tasks. Success means users accomplish goals quickly rather than spending extended time. Focus on speed, reliability, and removing friction.
News and magazine apps: Highest percentage of daily active users. Event-driven spikes in downloads but struggle with long-term retention. Push notifications about breaking news drive session frequency.
How to Track Mobile App Engagement Metrics
Choose the Right Analytics Tools
Google Analytics / Firebase: Comprehensive free option that tracks DAU, MAU, retention, and session metrics automatically. Ideal for most apps starting with engagement tracking.
Mixpanel: Event-based tracking that excels at understanding user behavior and funnel analysis. Powerful segmentation capabilities for advanced engagement insights.
Amplitude: Product analytics focused on understanding user journeys and behavior patterns. Strong retention analysis and cohort tracking.
UXCam: Session replay and heatmaps help you visually understand user interactions. Ideal for identifying friction points and usability issues that impact engagement.
Plotline: No-code platform for improving engagement metrics through in-app messaging, feature announcements, and personalized user journeys. Unlike analytics tools that only measure, Plotline helps you act on insights immediately without dev resources.
.png)
Track trends, not single data points: Don’t panic over daily fluctuations. Look at patterns over weeks and months. Seasonal variations, marketing campaigns, and product updates all create temporary changes.
Always connect metrics to action: Tracking without improvement is pointless. For every metric you monitor, have a hypothesis about how to improve it and test your ideas systematically.
Best Practices for Improving App Engagement
Personalize the User Experience
Generic experiences don’t drive engagement. Users expect apps to adapt to their preferences, behavior, and context. Implementpersonalized contentrecommendations based on past behavior, customize notifications to send at times when individual users are most likely to engage, tailor onboarding flows to different user segments, and use behavioral data to surface relevant features for each user.

Optimize Your Onboarding
First impressions determine whether users stay or churn. Deliver value immediately by showing users your app’s core benefit within the first minute, use progressive disclosure to avoid overwhelming new users with too many features at once, create contextual tutorials that teach by doing rather than lengthy explanations, and track onboarding completion rates to identify where users drop off.
Apps using Plotline for onboarding see Day 1 retention improvements of 15-30% by helping users reach their “aha moment” faster through guided, no-code onboarding flows.
Implement Strategic Push Notifications
Push notifications are powerful re-engagement tools when used correctly—annoying spam when done wrong. Focus on value by ensuring every notification provides genuine benefit to the user, personalize based on behavior and preferences rather than sending generic blasts, time notifications strategically based on when users typically engage, and make opting in attractive by clearly explaining notification benefits during onboarding.
Test notification content, timing, and frequency to find what resonates with your audience. One size doesn’t fit all.
Build Habit-Forming Features
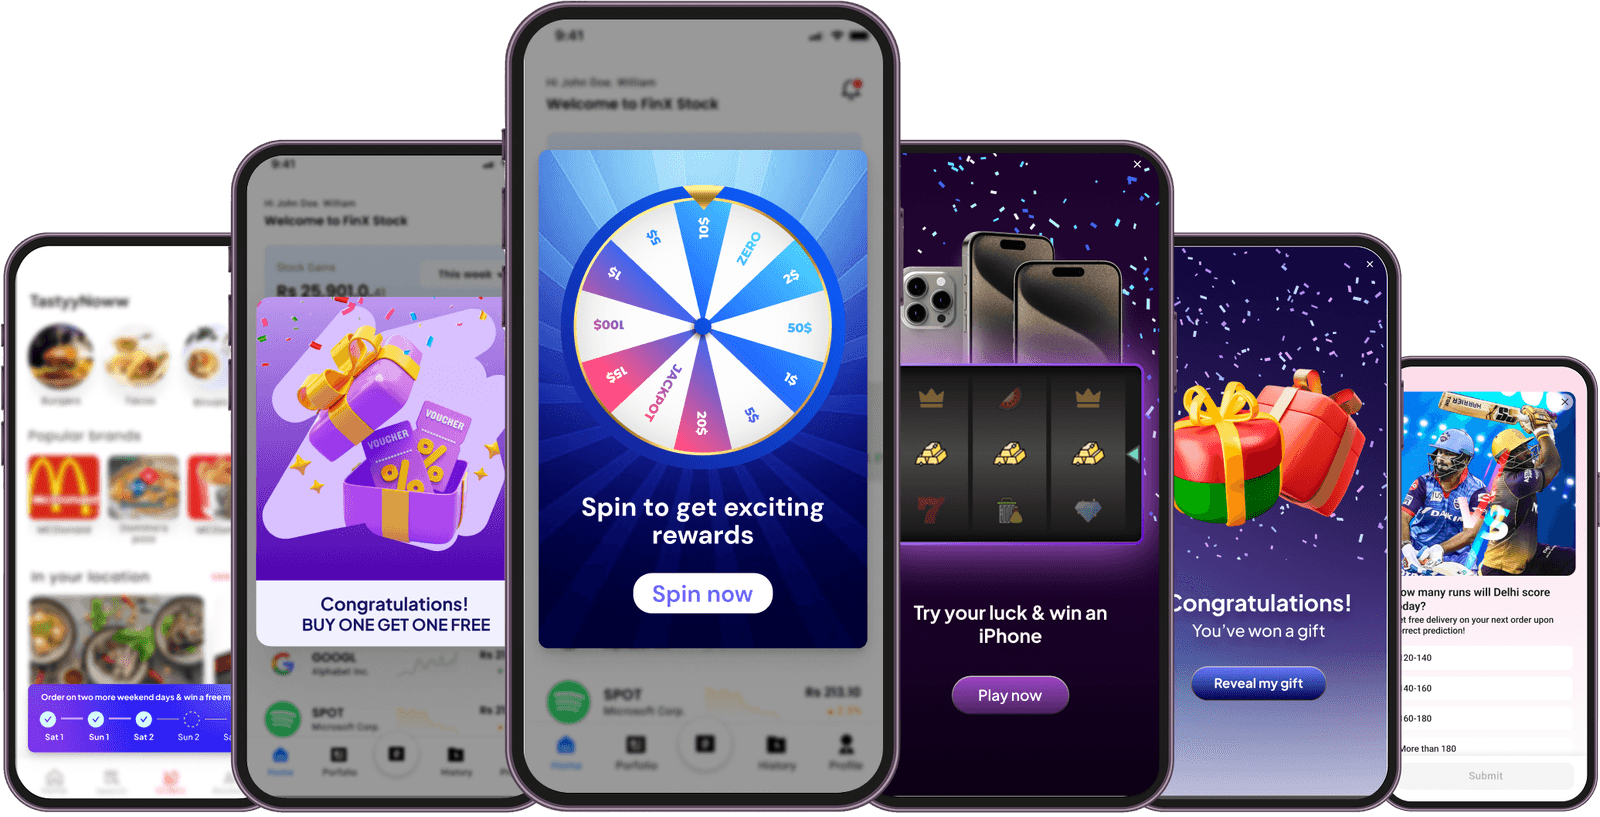
Apps that become daily habits achieve the highest engagement. Create features that benefit from consistent use (like streaks or progress tracking), implement social elements that give users reasons to check in regularly, use gamification strategically to reward engagement without feeling manipulative, and ensure your core features are always accessible with minimal friction.
Act on User Feedback
Engagement metrics tell you what users do, but feedback tells you why. Conduct regular user surveysto understand satisfaction and desires, analyze app store reviews for common complaints and feature requests, use in-app feedback tools to gather context-specific insights, and close the loop by showing users you’ve acted on their feedback.
Apps that actively respond to feedback build stronger user relationships and see higher engagement as users feel heard and valued.
How Plotline Accelerates Engagement Optimization
Traditional approaches to improving engagement metrics involve lengthy development cycles. Want to test a new onboarding flow? That’s a two-week sprint. Need to announce a feature? Another sprint. By the time changes deploy, your window of opportunity has closed.
Ship Engagement Improvements in Hours, Not Weeks
No-code in-app experiences: Plotline enables product teams to create and launch contextual nudges, widgets, games , and user journeys without writing code. Design, test, and deploy in hours.
Behavioral triggers: Show the right message to the right user at exactly the right moment. Trigger messages based on user actions, inaction, session count, feature usage, or any custom event.
Built-in A/B testing: Test different messages, offers, and flows to optimize engagement systematically. See what works and double down—no guesswork required.
Ready to boost your app engagement without the dev bottleneck? Plotline helps consumer apps increase DAU/MAU, reduce churn, and drive feature adoption, all without writing code. Book a demo to understand how leading apps are moving engagement metrics faster with Plotline.
