Understanding silent churn transforms how you retain users. When users gradually disengage without obvious signals, often appearing “active” while planning to leave, you have a powerful opportunity to intervene and bring them back.
TL;DR:
- Silent churn happens when users gradually disengage without obvious signals but leaves clear behavioral breadcrumbs you can track
- Journey-specific disengagement predicts churn 2-3 weeks before users leave entirely, giving you a meaningful intervention window
- Early warning signals appear within 3-7 sessions: declining session duration, feature abandonment, and irregular usage patterns
- Dormancy differs from churn. Most users pause before leaving, creating recovery opportunities
- DAU/MAU ratiosunder 20% signal silent churn risk, even when absolute user counts look healthy
What Is Silent Churn and How Does It Work?
Silent churn occurs when users gradually disengage from your consumer app without uninstalling or providing feedback. Unlike traditional churn where users actively quit, silent churners remain in your database, creating misleading stability in your metrics.
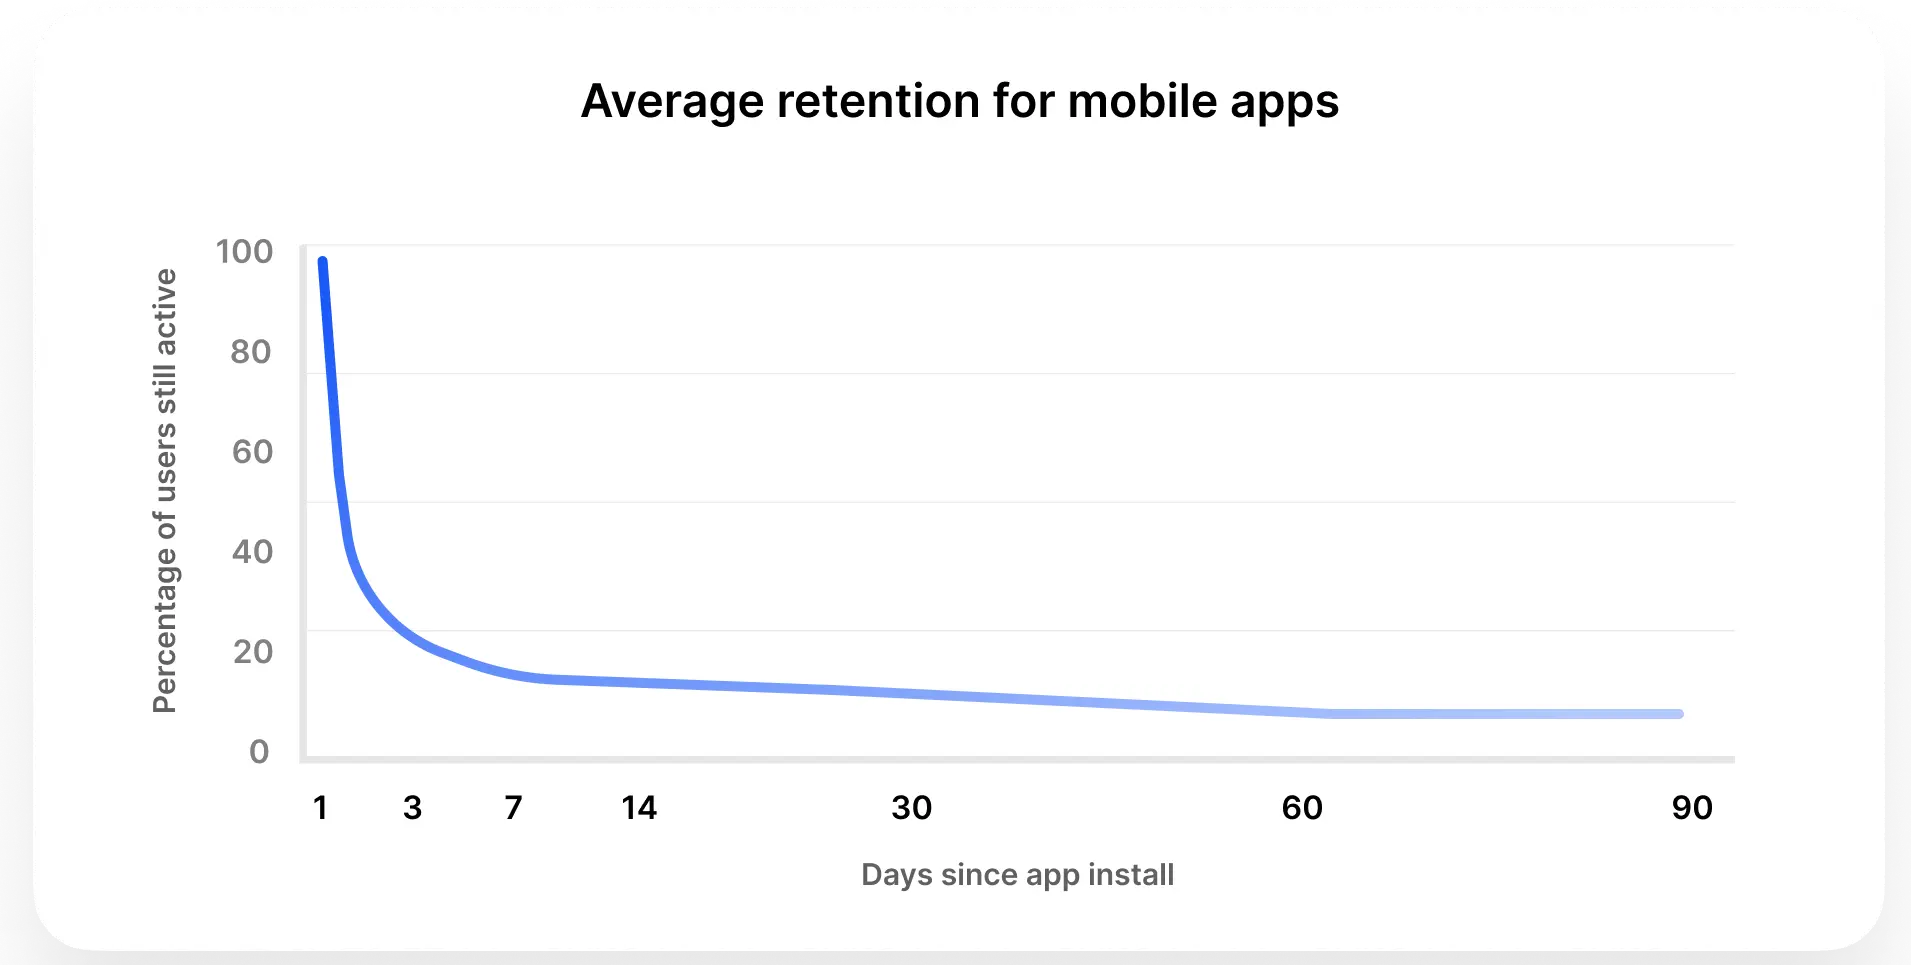
The opportunity here is significant: research shows that 70% of lifestyle app users abandon within 100 days, but most disengage silently before taking any explicit exit action. This means you have weeks of behavioral signals to work with before users make their final decision.

The Three Stages Users Move Through
Understanding this progression helps you intervene at the optimal moment:
Engaged Users show regular activity, consistent feature usage, and predictable return patterns. These users have integrated your app into their routine.
Dormant Users display temporary inactivity but aren’t lost forever. This is defined by no key actions within your product-specific threshold, typically 7-30 days depending on expected usage frequency. This is your intervention sweet spot.
Churned Users show extended inactivity beyond your typical usage cycle, usually 28+ days. Recovery is still possible but requires more effort.
The insight: almost every churned user passes through dormancy first. Catch them in the dormant phase with the right message, and you can recover them. The reactivation rate during early dormancy reaches 60-70%, compared to just 3-5% after users fully churn.
Which Users Look Engaged But Are Actually About to Churn?
This is where journey analytics reveals patterns that surface-level metrics miss: users who appear active in your dashboards but exhibit declining commitment beneath the surface.
The Check-In But Don’t Stay Pattern
When DAU/MAU ratios fall below 20%, you’re experiencing silent churn. Users open your app, keeping them in your “active” count, but don’t perform meaningful actions. They’re checking in out of habit while value delivery has stalled.
Track these behavioral markers:
Session duration decline shows users who previously spent 8-10 minutes now spending 2-3 minutes. This shift typically happens over 2-3 weeks and indicates declining perceived value.
Shallow interaction patterns reveal users opening the app, viewing one screen, and closing immediately. These users are looking for something specific that you’re not delivering.
Abandoned core actions happen when users stop mid-flow without errors. They simply stop clicking. This is different from technical failures; it’s a motivation problem.
Feature avoidance occurs when users steer clear of features they previously used regularly. When users narrow their feature usage from 5 features to 2, they’re preparing to leave.
The Time-to-Aha Failure Signal
Users who never hit their first “aha moment” follow a predictable path toward churn. If 60% of your users fail to experience core value within their first few sessions, you’re not dealing with afeature adoption problem. You have a value communication opportunity.
For consumer apps, this manifests differently across categories:
- Fitness apps see that users who don’t complete their first workout within 3 days rarely become regular users.
- Social apps find that users who don’t make a connection or post content in their first session have 5x higher churn.
- Entertainment apps discover that users who don’t finish one piece of content in their first session typically don’t return.
- Food delivery apps learn that users who don’t complete checkout in their first two sessions have dramatically higher abandonment rates.
What Engagement Pattern Predicts Churn Before It Happens?
Predictive churn patterns emerge 2-4 weeks before users actually leave, giving you a meaningful window to intervene with helpful guidance.
The Declining Trajectory Pattern
Analysis of user sessions across consumer apps reveals a consistent pattern:
- Weeks 1-2: show normal engagement with users exploring features and building habits.
- Weeks 3-4: display session frequency dropping by 30-40%. This is the first subtle signal.
- Weeks 5-6: reveal session duration decreasing by 50% or more. Users are no longer finding value.
- Week 7 and beyond: lead to visible churn events like rare app opens and eventual departure.
The intervention window is meaningful. You have approximately 14-21 days from the first engagement decline to provide value in a new way before users mentally commit to leaving.
The Broken Habit Loop Signal
Users develop habit loops with your app. Specific actions at predictable intervals. When these loops break, it’s an invitation to help them re-establish the habit with fresh value.
Research on the “habit path” shows that disrupted behavioral patterns are among the strongest churn predictors. Early Twitter research found that users who stopped following new accounts had significantly higher churn risk.
Monitor these habit loop indicators:
- Login frequency patterns show gaps widening between sessions, from daily to every 3 days to weekly.
- Feature engagement consistency reveals irregular usage of previously-regular features, suggesting declining value perception.
- Time-of-day pattern changes happen when users who logged in mornings now only check evenings, indicating reduced priority.
- Milestonebehavior abandonment occurs when users stop sharing, creating content, or completing achievements.
The Multi-Channel Disengagement Cascade
When engagement fades across multiple touchpoints simultaneously, it’s your clearest signal to reach out with renewed value.
Declining engagement across channels is far more predictive than single-channel drops. Look for:
- Lower email open rates
- Reduced response to push notifications
- Less branded search activity
- Lower click-through rates on in-app messages
When users disengage from 3 or more channels within a 2-week window, it’s time for a personalized re-engagement approach highlighting features they haven’t discovered yet.
Are Users Ghosting You Slowly or Dropping Suddenly?
Most users ghost slowly, which creates opportunities for intervention rather than panic. Understanding the timeline helps you catch them early.
The Gradual Decay Model (80% of Cases)
Most churn follows a gradual decay pattern you can track:
- Sessions 1-5 feature high engagement, exploring features and building understanding.
- Sessions 6-10 show engagement plateau as routine usage gets established.
- Sessions 11-15 display first signs of decline with shorter sessions and fewer features used.
- Sessions 16-20 reveal visible disengagement through irregular logins and abandoned flows.
- Sessions 21 and beyond enter recovery phase or terminal phase.
Platform data shows that iOS apps have an average churn rate of 96.3% by day 30, while Android reaches 97.9%. But this isn’t sudden. It’s a steady erosion punctuated by a final abandonment decision, giving you multiple moments to intervene.
The Sudden Drop Model (20% of Cases)
Some users do drop suddenly, typically triggered by specific events:
Critical incidents like technical failures, payment issues, or major bugs that break trust.
Competitive events such as compelling competitor launches or promotions that shift attention.
Life changes including new jobs, relocations, or life stage transitions that change app needs.
Seasonal factors like school schedules, holidays, or fiscal year cycles that disrupt habits.
Even “sudden” churners often show subtle warning signs 1-2 weeks prior. Decreased session duration, support ticket submissions, or negative sentiment in feedback. These are opportunities to proactively address concerns.
How Many Sessions Before Disengagement Shows Up?
Disengagement signals typically appear within 3-7 sessions of the behavior change that will eventually lead to churn. Consumer app retention research confirms that:
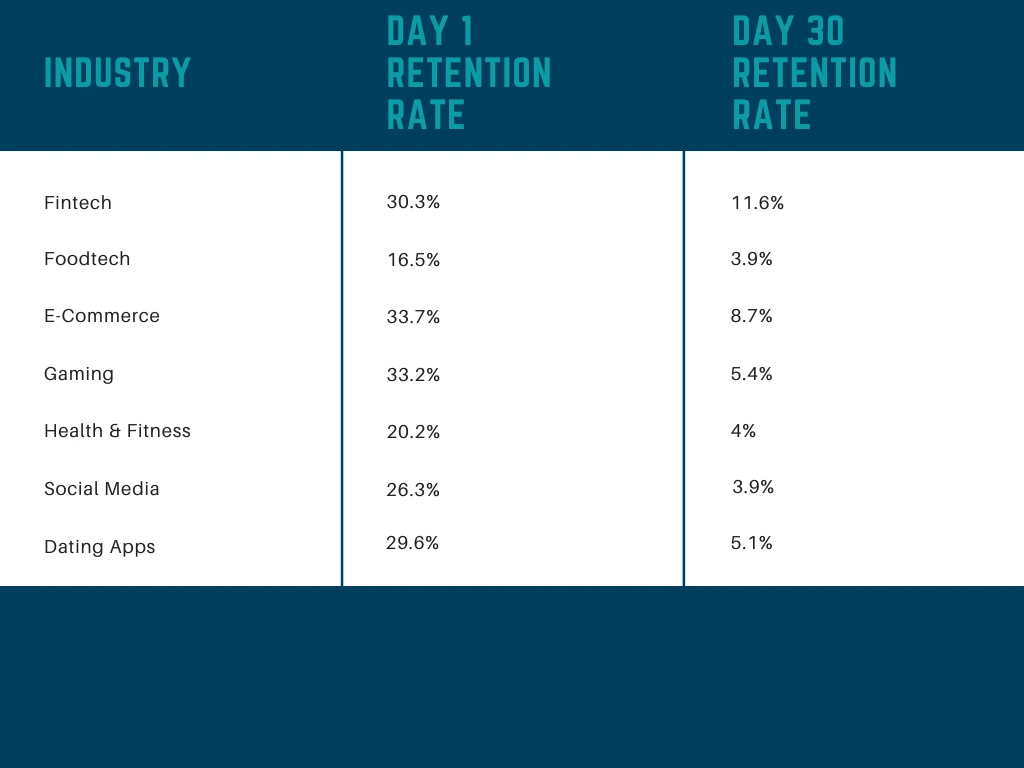
- Day 1 retention averages 25% across industries
- Day 7 retention measures initial habit formation
- Day 30 retention, typically 6% average, indicates sustainable engagement
Users showing declining engagement by session 10-12 are at critical risk, but they’re also still reachable. If intervention doesn’t happen by session 15, recovery probability drops below 30%.
Do Users Disengage from Specific Journeys Before the App?
Yes. This is one of your most actionable early warning systems for predicting and preventing churn.
Journey-Specific Churn Precedes App-Level Churn
Users typically abandon specific in-app journeys 2-3 weeks before they stop using the app entirely. This gives you a clear intervention roadmap: identify which journeys are failing, understand why, and provide better guidance.
Common journey abandonment sequences in consumer apps:
E-commerce and shopping apps follow this pattern:
- Users stop completing checkout as abandoned carts increase
- Browsing sessions shorten
- Search usage declines
- App opens decrease
Fitness and wellness apps show this sequence:
- Users stop logging workouts or meals
- Feature usage narrows to passive tracking only
- Social sharing stops
- Login frequency drops
Social and content apps display this progression:
- Content creation stops as users become passive consumers
- Social interactions decline with fewer likes, comments, and shares
- Session frequency decreases
- Session duration shortens
Food delivery and quick commerce apps reveal this pattern:
- Users browse but don’t add items to cart
- Cart additions happen but checkout gets abandoned
- Users stop opening promotional messages
- App usage becomes irregular
Research on onboarding impact confirms that 75% of users abandon products within the first week if specific journey experiences are confusing or fail to deliver value. The opportunity: fix the journey, recover the user.
Ready to catch silent churn before it happens?
Plotline helps product and growth teams at consumer apps like Meesho, Upstox, EatSure, and Airtel spot disengaging users early and intervene at the right moment.
- No-code in-app experiences let you deploy tooltips, spotlights, stories, videos, and gamification elements without waiting on dev resources. Build and launch in 15 minutes.
- Real-time behavioral triggers catch users during early dormancy when reactivation rates are highest. Target the right user with the right message at the right time.
- Journey-specific interventions help you guide users through onboarding, feature adoption, and monetization flows with native UI elements that match your design theme.
Companies using Plotline see measurable impact on activation, retention, and monetization:
- Upstox achieved 80% higher feature adoption using Plotline’s UI elements
- Niyo saw a 35% jump in debit card adoption with full-page video education
- BharatPe reduced go-to-market dev effort by 25%
Book a demo to see how Plotline helps you turn behavioral signals into retention wins.
The Onboarding Incomplete Recovery Opportunity
Users who never complete onboarding are 3-5x more likely to churn, but they’re also telling you exactly what they need: clearer guidance. Journey analytics consistently show:
- Users who complete onboarding checklists: 70% or higher retention at Day 30
- Users who skip onboarding: 20% retention at Day 30
The journey-specific signal worth tracking: not just whether users open your app, but whether they complete critical paths like tutorial completion, first meaningful action, or initial setup flows. When users stall, guide them forward. Here is a 11-step onboarding checklist that you can follow.
How leading consumer apps address onboarding abandonment:
Google Pay uses tooltips to educate new users on how to use two critical features: making payments to contacts via search and scanning QR codes. This ensures users are aware of these features and can activate their accounts more quickly.

The Core Feature Avoidance Pattern
When users systematically avoid the features that define your value proposition, they’re signaling a need for education or alternate pathways. Feature engagement analysis reveals opportunities:
- Users engaging with Feature A but not Feature B typically churn. Consider introducing Feature B differently.
- Users engaging with both Features A and B typically retain. Make this the default path.
- Users who previously used Feature B but stop are highest-risk. Understand what changed in their behavior or needs.
This pattern appears 14-21 days before traditional churn metrics trigger alerts, giving you time to re-introduce value through better onboarding or contextual education.
Are You Confusing Churn with Dormancy?
This distinction transforms how you allocate retention resources, letting you focus energy where it matters most.
Defining the Difference
Dormancy means temporary inactivity with high reactivation potential. Users haven’t left. They’re on a break, and they’re open to returning.
Churn indicates extended or permanent departure. Users have mentally checked out and need a stronger value proposition to return.
The opportunity: standard analytics treat all inactive users the same, but dormant users who are recoverable with low effort respond very differently than churned users who need re-onboarding.
Analysis of engagement and dormancy shows that failing to distinguish these groups leads to wasted retention spending on truly churned users with low ROI and missed opportunities with dormant users who need different messaging.
How to Distinguish Dormancy from Churn
Dormancy Indicators include:
- Inactivity period within 1-2x your normal usage cycle. For a weekly-use app, 2-3 weeks of inactivity.
- No negative feedback or support complaints before going quiet
- Historical pattern of intermittent usage as users naturally take breaks
- Triggered by predictable events like seasons, school schedules, or content completion
Churn Indicators include:
- Inactivity exceeding 3x your normal usage cycle, typically 28 or more days
- Preceded by declining engagement across multiple metrics
- Support tickets or negative feedback in the weeks before going silent
- Account changes like subscription downgrades or payment method removals
Research on behavioral patterns shows churned users display consistent engagement decline across 4-6 metrics simultaneously, while dormant users often show stable engagement with temporary absences.
The Dormancy-to-Churn Timeline
Most users don’t jump directly from engaged to churned. They progress through stages that create intervention opportunities:
Week 1 shows engaged baseline behavior.
Week 2-3 displays early dormancy with missed 1-2 expected sessions. This is prime time for helpful reminders.
Week 4-5 reveals deep dormancy with no activity but recoverable status. Time for value re-introduction.
Week 6-7 indicates late dormancy as recovery probability declines. Consider new value propositions.
Week 8 and beyond signals churn as users are effectively lost. Requires full re-onboarding.
Reactivation success varies dramatically by stage:
- Early dormancy: 60-70% reactivation rate
- Deep dormancy: 30-40% reactivation rate
- Late dormancy: 10-20% reactivation rate
- Churn: 3-5% reactivation rate
The key: intervene during early dormancy with relevant, helpful messaging, not generic “we miss you” campaigns.
How to Build an Early Warning System for Silent Churn
Step 1: Define Journey-Specific Success Metrics
Stop measuring only app-level engagement. Track completion rates for critical in-app journeys:
- Onboarding completion rate
- Core feature adoption within first 7 days
- Secondary feature discovery by day 14
- Social or sharing actions by day 21
Users failing to progress through these journeys are your highest-risk segment.
Step 2: Create Engagement Momentum Scores
Build health scores combining:
- Login frequency weighted by expected usage
- Session duration trends showing declining versus stable patterns
- Feature breadth measuring number of unique features used
- Social or collaborative actions
- Support interactions including tickets and negative feedback
Users with declining momentum scores for 2 or more consecutive weeks trigger intervention workflows.
Step 3: Implement Behavioral Cohort Analysis
Segment users by shared characteristics:
- Acquisition channel cohorts show that users from different sources churn differently.
- Behavioral cohorts reveal that users who complete specific actions retain differently.
- Time-based cohorts display retention curves showing when disengagement typically starts.
Research on retention analysis shows that cohort comparison reveals which user groups are highest-risk within your identified churn window.
Step 4: Deploy Real-Time Intervention Triggers
Create automated workflows triggered by:
Session duration drop of 50% or more over 2 weeks
Feature abandonment when users stop using previously-regular features
Irregular usage when users miss 2 or more expected sessions
Journey abandonment when users fail to complete critical flows 3 or more times
Multi-channel disengagement when users ignore push, email, and in-app messages
Time these interventions carefully. Research confirms that messaging within 24-48 hours of disengagement signals is most effective.
How Plotline Makes This Actionable
Building an early warning system sounds complex, but Plotline makes it practical for consumer app teams:
Event-based targeting lets you trigger in-app messages based on specific user behaviors like declined session duration, feature abandonment, or irregular usage patterns.
Usersegmentation helps you identify high-risk cohorts and target them with personalized re-engagement experiences.
No-code deployment means your team can build, test, and launch interventions in minutes, not weeks. No engineering backlog required.
Native UI elements like tooltips, spotlights, stories, and videos blend seamlessly with your app design, creating non-disruptive intervention moments.
A/B testingcapabilities let you experiment with different intervention strategies to find what works best for your users.
.webp)
Leading consumer apps use Plotline to turn silent churn signals into recovery opportunities. When Jar identified users at risk of abandoning their GoldX feature, they deployed a Spotlight using Plotline and saw 80% higher adoption among users who saw the intervention versus those who didn’t.
See how it works in a personalized demo for your app.